4.1 How to achieve a high level of beauty in the built environment
The New European Bauhaus (NEB) paradigm (COM, 2021a) identifies, within the dimension of Beauty, two primary requirements for the built environment: ensuring an adequate quality of experience for the users and presenting a pleasant level of aesthetics and style that transcends functionality. This revisits the principles of Vitruvian tradition, wherein architecture was regarded as a reflection of nature, and where aesthetic quality (venustas), stability (firmitas) and utility (utilitas) stood as its fundamental attributes.
Research indicates that the aesthetic component of the Beauty dimension is a desirable element of the human living environment (Coburn et al., 2017). In the past, the prevailing view was that the visual aspect of beauty in architecture results from the perfect construction of a building, being a function of the proportions of the parts and their relationship to the whole. In this approach, beauty could be “measured”. Changes in the definition of aesthetic quality were brought by modern empiricism, which assumed that since we are born without innate ideas about beauty, we can only judge it based on our own experiences — pleasure or lack thereof. Some empiricists believed that its evaluation could only be subjective, while others pointed out that it could be treated in universal terms, since people have common experiences that influence their judgements (Tatarkiewicz, 1980).
In the past century, beauty as an aesthetic category has lost its importance. In the wave of modernism, there was a paradigm shift in architecture ('form follows function'), and the discussion of beauty was also hampered by postmodern anti-aesthetics concepts. Since the 1990s, the academic discourse has called for a 'reclaiming' of beauty, even though this is often seen as an ideological statement, usually conservative. However, aesthetics is neither an ideological nor a political issue, even though it may relate to the local values and cultural ideals of a community (van Damme, 1996). Aesthetics concerns the relationship between object and subject in a particular situation or environment (Sartwell, 2004). Aesthetic quality is a kind of matching function between form and its context. Moreover, it is nowadays presented as one of the conditions for human wellbeing, and even as an element necessary for the health and survival of our species. This underscores the necessity for a comprehensive evaluation of these aspects within a common unified dimension.
There is a need to draw the attention of designers to issues of beauty in the built environment and to support solutions that go hand in hand with EU policies. Achieving beauty in the built environment should be a conscious pursuit and an explicitly declared objective of place-making, planning or building (European Commission, 2021b). This is inherently related to the preservation of cultural heritage, including rediscovery of history of architecture and places that feel familiar, or places that are in harmony with the natural world. The same protection and care should be extended to unique places and forms that appeal to people’s creativity and imagination (COM, 2021b).
Today, various models for the aesthetic quality of architecture and the built environment are identified. This is characterised by the coexistence of traditional architecture and new building styles, depending on the region, available technology, and climatic conditions. As a result, European modern and historical architecture is characterised by a desirable diversity that should be enhanced and protected. At the same time, we are witnessing and contributing to a paradigm shift in the creation of living spaces. The contemporary approach emphasises sustainable design, environmental protection, supporting local communities, and satisfying aesthetics. There is an increasing use of local, natural building materials, greater attention to the material and cultural surroundings, and a concern to perpetuate the heritage for future generations of Europeans. Human beings remain the focus of architects’ and planners’ attention, but modern science is creating new tools to assess their wellbeing, including aesthetics.
Built heritage should be enhanced or preserved and contemporary design should take into account the sense of place and the characteristics of natural and cultural heritage, open landscapes, sites and buildings, including their context. Context in relation to the New European Bauhaus refers to the built and non-built environment and landscape in terms of scale, typology and materiality, while sense of place encompasses the local character, unique identity and distinctiveness of a place and the attachment of people to that place (European Commission, 2021b). Beauty, context and sense of place are essential criteria for high-quality Baukultur within the Davos Baukultur Quality System. Importantly, places with high-quality Baukultur, well embedded in their built and natural context, encourage people’s emotional response to the place by building a positive relationship with it. A crucial part of such context is an overall sensory experience, in which a sense of place is built with understanding of the relationship between objects, spaces and people, enhancing user satisfaction and quality of life (SFoC, 2021).
Assessing and improving beauty in an all-encompassing and integrated way within the built environment and place-making projects require taking into account all the characteristics, connections and phenomena of a geographically defined area in which a place – a single building or a larger unit such as an industrial area or a village – is embedded. In other words, the relation of a place to its surroundings is required at any scale over time. It is, thus, crucial that contemporary design activities consider the sensory perception of the place – visual, acoustic, tactile and olfactory impressions – and that the project solutions foster the creation of a strong sense of place and offer high performance landscapes and sites as places to live, work and recreate. This is expected to provide aesthetic enjoyment, encourage identification and familiarity, contributing to increase the attractiveness for residents and tourists, going beyond the artistic dimension to produce a positive impact on wellbeing of the inhabitants/users of buildings and spaces.
Beyond addressing the aesthetic, psychological and cultural needs of the people in their relationship with the surrounding built environment, setting functional and technical requirements is essential to ensure the high-quality and liveability of projects and spaces for everyone and for the long term. Thus, Beauty is further strongly concerned with two objectives connected to the quality of experience.
The first one seeks to enhance within the built environment the comfort, wellbeing, health and safety of users, regardless of age, ability or background, in normal operational conditions and in face of potential natural and man-made hazards. The built environment is exposed to various hazards that can cause extensive damage, resulting in substantial economic losses and, in extreme cases, loss of lives. Within this first objective, it is crucial to reduce the impact of such hazards by ensuring a comprehensive assessment of the risks and adopting adequate solutions to mitigate them, enhance preparedness and functionality retention, minimise the operation disruptions and allow a swift recovery process following the emergency. However, threats to users are not only posed by disasters. Significant background noise from external and internal sources of airborne, impact noise and noise from services, poor perceived thermal comfort, and inadequate quality and composition of natural and artificial lighting may compromise overall physical, mental and social wellbeing of the users. On the other hand, design solutions that integrate opportunities for physical movement to prevent sedentary behaviour or physical inactivity may improve user health and productivity. Finally, a further reduction of risk to people and enhancement of their wellbeing stem from a design that ensures the ease of use and operation for all, to the greatest extent possible, irrespective of their cognitive, physical, and sensory abilities.
The second objective aims to achieve high environmental performance through a circular use of construction products, beyond the expected service life, while integrating rigorous decision-making into the procurement and design processes. Within this objective, the integration of emerging and disruptive strategies and methods for data acquisition, automation, and digital information and analysis into the design and delivery activities is encouraged. Such integration may serve as a driver of enhanced quality of the products as well as increased safety of the actors involved in the construction and optimised allocation and consumption of resources. Furthermore, high-quality design, construction and management practices are promoted. This includes favouring more durable elements and components, adopting design solutions capable of accommodating changes in needs or market conditions and facilitating disassembly for reuse and recycling, to retain the highest utility and value of construction products over time. Responsible sourcing of construction products during procurement and efficient material use are integral to this objective. Such efforts are anticipated to reduce both mass and carbon embodied into buildings, mitigate consumption of resources and minimise waste production. Achieving these goals necessitates active involvement from all actors, namely design teams and contractors, with proven suitability to pursue professional activities, economic and financial standing, technical and professional ability as well as extensive experience with certification, design, construction and/or management of buildings and living spaces with improved environmental performance.
4.2 Assessment targets to achieve
To ensure that a high level of beauty is achieved eleven assessment targets are identified, each addressing key concerns in the evaluation process.
4.2.1 Integration of emerging technologies
Digital technologies have emerged as enablers of enhanced customer experience, quality, competitiveness, transparency, safety, resource efficiency and productivity (Baldini et al., 2019; ECSO, 2021). Therefore, their integration across key sectors of the economy is expected to actively contribute to sustainable development, by introducing novel production processes. In particular, the European Union has taken proactive steps towards the digital transformation of the construction sector. This sector is currently one of the least digitalised in the economy, characterised by a low adoption rate of innovative systems and methodologies. Furthermore, considerable variability in market maturity and technology readiness across different disciplines and stakeholders is present throughout the entire building lifecycle and supply chain (Papadonikolaki et al., 2022). Full scale digitalisation of the construction sector is expected to yield annual global savings up to 20% across diverse stages of the building lifecycle (Baldini et al., 2019). This digital transformation is expected to optimise production and generate new business models, replacing some existing jobs while creating new ones. This shift is fostered by manual labour automation, digitalisation of processes and coordination of tasks and activities (van der Heijden, 2023). A significant impact within the construction sector is also anticipated in terms of safety. Digital technologies have the potential to drastically enhance worker safety by reducing the likelihood of errors, supporting training initiatives and skills development, and minimising or replacing human involvement in heavy physical labour, operations in hazardous environments and repetitive tasks (Trask and Linderoth, 2023). To this end, the establishment of a secure environment that facilitates the safe interaction and coexistence of human operators and robots in construction sites is a key enabler (Baldini et al., 2019). Finally, the Smart Building, Infrastructure and City paradigm is leveraging digitalisation and big data revolution to enhance resilience and performance of built assets.
The commitment of Member State policymakers to digitalisation is evident through the implementation of active measures to foster this transformation. Support mechanisms include grants, loans and equity investments as well as the provision of technical assistance and platforms dedicated to skills development and knowledge transfer. Furthermore, the widespread adoption of e-services, for purposes ranging from data storage and sharing to streamlining administrative and bureaucratic procedures, plays a pivotal role in facilitating the digital transition (ECSO, 2021).
Three categories of emerging technologies for the Architectural Engineering and Construction (AEC) sector have been identified (Baldini et al., 2019; ECSO, 2021):
- Data acquisition: sensors, internet of things (IoT), 3D scanning.
- Automating processes: robotics, 3D printing, drones.
- Digital information and analysis: building information modelling (BIM), virtual/augmented reality (VR), artificial intelligence (AI), digital twins.
Some of the above technologies are more relevant for construction or operational phases of the building lifecycle, while the present self-assessment method focuses on promoting their integration into decision-making and processes at the design phase.
4.2.2 High-quality design and delivery
The organisation, qualification and experience of the actors involved in the design, construction operation, maintenance and deconstruction of a built asset significantly influence the quality of design and delivery and the final performance of projects. Therefore, the Public Procurement Directive (Directive, 2014) define a set of criteria for contract awarding that emphasises competences and expertise required of the involved parties. The use of these criteria should be expanded in procurement processes to enhance competitiveness and quality. The European Union has been actively promoting this transition by advocating for strategic plans for green and circular procurement, as well as introducing voluntary or mandatory criteria for selection. These initiatives aim to address a prevailing trend where more than 50% of the procurement procedures in the public sector adopt the lowest price as the award criterion (European Commission, 2017b). Green Public Procurement (GPP) extends beyond the Public Procurement Directive (PPD) criteria, specifically targeting goods, services and works with high environmental impact. GPP promotes the procurement of products that reduce this impact and minimise waste throughout their life cycle, compared to non-green alternatives with the same primary functions that may otherwise be selected (COM, 2008). Similarly, a circularity-driven approach to procurement shifts the focus from short-term needs to long-term consequences of each purchase (European Commission, 2017a). The positive impact of sustainable procurement transcends environmental benefits and encompasses social and economic dimensions (ISO, 2017c).
In this perspective, procurement serves as a catalyst for fostering responsible production and consumption patterns. Markets for environmentally friendly products and services can be created or expanded by raising awareness and driving demand for ‘greener’ goods. Green markets, in turn, are expected to incentivise innovative businesses and solutions, including smart and clean technologies. Therefore, the attention is not only directed towards the competencies of the involved parties but also towards the characteristics of the products (COM, 2008). Moreover, sustainable procurement aims to promote ethical behaviour across its supply chains, avoiding bias and prejudice in decision-making, providing equal opportunities, identifying and preventing violations of the rule of law, and respecting internationally recognised human rights (ISO, 2017c). To achieve this ethical behaviour in production, purchase and consumption, ensuring a transparent, legal and responsible material sourcing is essential. All organisations should be committed to continually improve their practices, avoiding complicity with wrongful acts and taking responsibility for the actions and decisions made.
Although the aforementioned criteria for green and circular procurement have been developed with a focus on public procurement, they can equally inform private procurement practices, since the principles of responsible production, consumption, and ethical sourcing are relevant and beneficial across both domains (COM, 2008).
Finally, transition to a more circular economy implies promoting sufficiency, thus preventing excessive and unnecessary material consumption. The quality of design can be assessed in terms of efficient use of materials aiming at doing more with fewer resources. Ensuring, by design, the long-term resource efficiency throughout the building life cycle is a primary goal highlighted by the Level(s) framework (Dodd et al., 2021a). BS 8895 series (BSI, 2013a, 2015a, 2019) outlines material-efficient processes, key tasks, team members and their responsibilities, outputs specific to each work stage, along with supporting guidance and tools. Examples of suitable design measures for material efficiency can include:
- Increasing the utilisation factor of structural members.
- Designing to standard material dimensions to reduce offcuts and waste on site.
- Removing redundant materials from the design.
- Using materials that can be recycled and/or reused at the end of their service life.
- Making use of recycled and/or reclaimed materials.
- Designing for deconstruction and material reuse.
- Using prefabricated elements where appropriate to reduce material waste.
- Consider using an ‘exposed thermal mass’ design strategy to reduce finishes.
- Avoiding overspecification of predicted loads.
- Using lightweight structural design strategies.
- Making use of bespoke structural elements to reduce overall material use.
- ‘Rationalisation’ of structural elements.
- Optimising the foundation design to reduce embodied environmental impact.
Some of these measures, such as recycling, reuse, use of standard components and offsite construction are evaluated within other assessment targets of the Beauty dimension (e.g. Sections 4.2.1, 4.2.6) as well as in the Sustainability dimension (e.g. Sections 3.2.6, 3.2.9). The remaining main aspects are addressed within the present target.
4.2.3 Resilience of the built environment
Since 2004, over 3.3 billion people worldwide have been either injured, killed or left homeless due to natural disasters (CRED, 2024). In the EU, from 1980 to 2020, natural hazards affected nearly 50 million people and have cost Member States on average EUR 12 billion per year (World Bank, 2021). Recent years have seen an increasing trend in the number of disasters, fuelled by increasing urbanisation and environmental degradation that results in higher exposure of people and assets to natural hazards. With climate change expected to bring more extreme weather events and sea level rise, the severity of natural hazards is projected to increase, and with it the potential for higher losses in future disaster events. Growing political instability, geopolitical tensions and diversification of hostile groups, result in the potential for increased terrorist threats (NIC, 2023). Several global policies and directives have been issued to support measures for reducing risk from natural and man-made disasters. The most important is the Sendai Framework (UNDRR, 2015) which was issued by the UN General Assembly following the 2015 Third UN World Conference on Disaster Risk Reduction (WCDRR). The Sendai framework presents a paradigm for understanding and managing systemic risk from natural, human-made, technological, environmental and biological hazards (UNDRR, 2015). It advocates that disaster risk reduction must be at the core of economic, social and environmental policy at all levels. It also recognises the link between disaster risk reduction and sustainability, highlighting that disasters can set back sustainable development goals as they undermine poverty eradication and magnify inequality (IRDR, 2014). The Sendai framework therefore calls for the substantial reduction of disaster risk and losses in lives, livelihoods and health, as well as in economic, physical, social, cultural and environmental assets of persons, businesses, communities and countries. The framework recognises that the state authorities have the primary role to reduce disaster risk, though this responsibility should be shared with other stakeholders including regional authorities and the private sector (UNDRR, 2015).
Achieving resilience under extreme events involves effective prevention, mitigation, preparedness, response and recovery. In the construction sector, the focus has traditionally been on the adoption of modern building codes for hazard resistance. This is an important part of the mitigation component of resilience, but project design can contribute to disaster response and recovery also, through the provision of means of evacuation, access for emergency services, and the preservation of functionality. Moreover, for a project to be inclusive for its users, measures need to be taken towards enhancing preparedness through training and drills, and organisational steps can be taken to promote faster restoration of services.
4.2.4 Health and wellbeing
The target addresses the design of indoor environment to promote physical, social and mental health and wellbeing. Time spent indoors accounts for roughly 90% of daily life (Fitwel, 2020). The quality, amenities and design of indoor environments are strongly linked to individual health outcomes and productivity.
According to the Environmental noise guidelines for the European region (WHO, 2018), environmental noise features among the top environmental hazards to physical and mental health and wellbeing, with a substantial associated burden of disease in Europe (WHO, 2011; Hänninen et al., 2014). In many cities across the EU, over 50% of the population (approximately 200 million people) are exposed to road noise levels above 55 dB day-evening-night level (Lden), which is above the recommended values by WHO (Kantor et al., 2021). Railway and aircraft noise affect a lower proportion of the EU population (approximately 50 million people), but both are significant sources of local noise pollution. Under the European Green Deal (COM, 2019), the EU has committed to achieve a zero-pollution ambition for a toxic-free environment. The 2021 zero pollution action plan 5 sets a specific target of reducing the number of people chronically disturbed by transport noise by 30% in 2030 as compared to 2017 (Directive, 2002). It is therefore widely recognised that providing a healthy acoustic environment is important.
External noise transmission into indoor areas is not the only source of noise discomfort. Indoor sources of noise also need to be considered in design. Most commonly, target indoor background noise levels and reverberation times are key metrics used to provide an appropriate acoustic environment within an enclosed space. Background noise (or ambient noise) must be calculated from external and internal sources of airborne, impact noise and noise from services (e.g. HVAC), considering the absorptive and reflective characteristics of façades, structural components and partitions. Reverberation times, indicate the suitability of sound transmission and speech intelligibility. They depend on the frequency of the noise as well as the absorptive properties of surfaces and fitting materials. The target values of these and other parameters adopted to define acoustic environments, vary with the use of the space, its type and level of occupancy, and with the needs of people using the space.
The quality and composition of lighting directly affects people’s ability to conduct tasks within a space. Moreover, lighting has also been shown to affect mental wellbeing and physical health. This is because humans’ circadian rhythm is linked to the natural day-night cycle, and the body requires periods of both light and darkness. Light exposure can affect people’s moods, symptoms of depression, and rates of healing (WELL v2, IWBI, 2020). Appropriate illumination and visual contrasts also contribute to the information needed for wayfinding and for safety (IWBI, 2020). It is therefore important to design and implement a holistic lighting strategy that combines natural and artificial lighting to provide visual acuity, comfort, physical and mental health, and contributes to wayfinding and safety. Such a strategy must account for the diverse needs of occupants of different ages and abilities.
Thermal comfort is defined as “the condition of mind that expresses satisfaction with the thermal environment and is assessed by subjective evaluation” (ASHRAE, 2023). Thermal discomfort strongly influences user wellbeing and productivity as it affects alertness, moods, motivation and focus (Lamb and Kwok, 2016). Thermal comfort is subjective with gender, age, and climatic conditions, all affecting perceived thermal comfort (Nicol and Humphreys, 2002). The location and typology of the building along with outdoor climate and season also influence thermal comfort of occupants (Frontczak and Wargocki, 2011). Since a unique design for thermal environment will not suit all people, designers should aim for a thermal performance of projects that is comfortable for as many people as possible (IWBI, 2020). Devices for regulating thermal comfort can help adjust the environment to individual needs. Thermal comfort is important throughout the year, hence, as a rule, both heating and cooling must be considered.
A large proportion of the EU housing stock cannot provide adequate levels of thermal comfort because of a combination of a lack of insulation, poor quality windows, cold bridging through the building fabric, high levels of air infiltration and inadequate or poorly maintained heating systems (Dodd et al., 2021e). Attempts to provide better thermal comfort can result in large energy consumption in heating and cooling. Thermal comfort is also linked to indoor air quality as both are strongly influenced by the HVAC system used. It is important that design for thermal comfort is considered together with design for better indoor air quality and lower energy consumption (see Sections 3.2.1, 3.2.2 and 3.2.5 in Sustainability).
In 2022, globally, 7.2% and 7.6% of all-cause and cardiovascular disease deaths, respectively, were attributable to physical inactivity, with the proportions of non-communicable diseases (e.g. hypertension, dementia) due to physical inactivity equal to 1.6% and 8.1%, respectively (Katzmarzyk et al., 2022). Despite wide knowledge of the health benefits of regular exercise, over a quarter of the adult population do not meet the current public health guidelines for physical activity (Guthold et al., 2018). Modern desk-based learning and working environments also promote sedentary behaviour. Sedentary behaviour is different from physical inactivity and is characterised as very low-intensity, low-effort activities, such as sitting, and has distinct health outcomes, including higher incidences of obesity, cardiovascular risks and premature mortality (Saunders et al., 2020). A recent study (Santos et al., 2023) evaluated that 500 million new cases of preventable non-communicable diseases would occur globally by 2030 if the prevalence of physical inactivity does not change, with direct health-care costs of EUR 480 billion. This is preventable, and it is critical that future projects promote more active living by integrating opportunities for physical movement into their designs. Several recommendations exist along these lines, such as the Active Design guidance (Sport England, 2023; Sport England and BREEAM, 2019), and the WELL Movement concept (IWBI, 2020).
4.2.5 Accessibility
Accessibility is a fundamental human right (United Nations, 2007), and is defined in the context of the built environment as “adjusting every detail of the built space to (accommodate) a large and varied group of potential users, with a focus on details of importance in relation to cognitive, physical and sensory abilities” (Andersson and Skehan, 2016). 87 million people with disabilities are reported to live in the EU (European Commission, 2021a). According to the World Health Organization, around 16% of the world's population has a disability, which equates to over 1.3 billion people worldwide (WHO, 2023). In March 2021, the European Commission adopted the ‘Strategy for the rights of persons with disabilities 2021-2030’ (European Commission, 2021a), which builds on a previous strategy (COM, 2010) and aims to improve the lives of persons with disabilities in Europe and around the world. The provision of dignified and non-discriminatory accessibility is a part of this strategy. It should be noted that ‘disabilities’ are considered as comprising long-term physical, mental, intellectual or sensory impairments, which are often invisible (in line with Article 1 of United Nations, 2007). Included in physical impairments are reduced physical strength, dexterity and mobility that are associated with ageing. Population ageing is a demographic trend that has been apparent for several decades in Europe, with the number of people aged 65 and over projected to increase from the 2019 value of 90 million to 130 million by 2050 (Eurostat, 2020). This process is driven by low fertility rates and increasing life expectancy, which has significant implications for society and the economy.
Making the built environment accessible is widely recognised as having a significant social benefit. However, other benefits co-exist. Firstly, consideration of the specific needs and requirements of users allows the identification and mitigation of hazards and risks, thus contributing to user safety (European Committee for Standardisation, CEN, 2021b). Secondly, significant economic benefits have been highlighted in the literature (Terashima and Clark, 2021). Accessible design can improve access to information and communication, improve efficiency, and reduce barriers to employment and career advancement, ultimately increasing productivity of people in society. Moreover, developers and building owners will benefit from user satisfaction and increased productivity, resulting in higher visitor rates, social branding opportunities, broadening markets, and lower renovation and operation costs (Steinfeld and Smith, 2012).
Achieving accessibility of the built environment requires consideration of a wide set of human abilities and characteristics, which may be conflicting at times. Achieving accessibility for all is therefore not simple. Several design movements have put forward approaches for accessible design. Amongst these, Universal Design is widely acknowledged and involves the design of products, environments, programmes and services to be usable by all people, to the greatest extent possible, without the need for adaptation or specialised design (Centre for Excellence in Universal Design, 1997). The Universal Design approach is based on seven principles: simple and intuitive use; flexibility in use; size and space for approach and use; perceptible information; low physical effort; tolerance for error; equitable use. These concepts run through the EN 17210 performance standard (CEN, 2021b), which was developed to aid implementation of the UN Convention on the Rights of Persons with Disabilities (United Nations, 2007) in Europe (COM, 2010). This performance standard and the associated technical report (CEN, 2021c) are described in Section 4.7, and are used in Section 4.8 as key references.
It would be beneficial to all projects to consider universal design principles in every design element, with consideration of its intended use and contribution to the project accessibility and functionality. In the context of the NEB self-assessment method, the design elements considered most important are those that contribute to ease of circulation, safe and intuitive wayfinding, and ease of use and operation of all amenities within the project boundaries.
4.2.6 Service life
Service life maximisation aims to ensure that buildings and products are designed to retain their utility and value over time. The current economy is dominated by a linear take-make-use-dispose principle, in which half of total greenhouse gas (GHG) emissions and most than 90% of biodiversity loss and water stress come from resource extraction and processing (COM, 2020). In particular, the construction sector generates over 35% of total waste in the EU, is responsible for about 50% of all extracted materials, and produces GHG emissions equal to 5-12% of total national emissions (COM, 2020). Most of the environmental impacts relate to the production and construction of structures and façades (Dodd et al., 2021c). As an alternative, circular economy has gained much attention. Circularity pursues a restorative and regenerative model that reduces single-use and premature obsolescence, decoupling economic growth and resource consumption and fostering the implementation of sustainable development goals (Ellen MacArthur Foundation, 2015; Murray et al., 2017; Schroeder et al., 2019; Dokter et al., 2021). The European Commission has proposed a Circular Economy Action Plan, as one of the main building blocks of the European Green Deal, to foster this systematic shift towards a climate-neutral, resource-efficient and competitive economy (COM, 2020). Responding to it, many EU Member States have adopted proactive implementation strategies.
A main goal of circular economy is to guarantee that products retain their highest utility, as well as their embedded environmental and economic value, over time (Ellen MacArthur Foundation, 2015; Webster, 2015; Nußholz, 2017; Reike et al., 2018; COM, 2020). Circular economy involves ensuring durability, maintainability, and repairability of products, maximising the value of the resources invested in their production. However, to ensure that such long-lasting products are not disposed before the end of their service life, designing buildings that are more easily adapted and upgraded to suit uncertain and fast-evolving future scenarios is essential. Flexible and adaptable systems can accommodate to changing household, personal and business circumstances, variations in the overall demand or conversions in the use. Design for adaptability and renovation does not simply address the capability of load bearing elements to sustain increased actions due to change in use or height and mass of the building. It also aims at facilitating future modification of the layout, and repurposing of internal spaces. Service and equipment distribution and their ease of replacement are additional critical aspects, as they typically pose a major barrier to change in use or changes in fuel or input energy sources (Dodd et al., 2021c).
Although adaptability may be more compelling for non-residential buildings, in residential buildings specific drivers of adaptability, like starting a family, ageing and changes in circumstances that lead to reduced mobility, alternative requirements for living spaces with different cultures upon changing tenure, as well as the need for suitable home working environments should be properly addressed (Dodd et al., 2021c). Some requirements for adaptability may be fulfilled by universal design principles (ISO, 2020), which are evaluated within the accessibility assessment target of the Beauty dimension (Section 4.2.5).
Circularity is further promoted by design for disassembly, deconstruction and reuse. Deconstruction principles and good practices comprise (ISO, 2020) independence, avoidance of unnecessary treatments and finishes, simplicity and standardisation. The ease of access to materials, components or connectors of an assembly, and the possibility of disassembling without the use of specialised equipment, causing negligible or no damage, is essential to prevent unnecessary waste during deconstruction. Leaving connections exposed, visible and accessible, with necessary room on all sides to operate them, is a way of promoting ease of disassembly for reuse. Moreover, elements with a minimum number and type of components, parts and materials are in general easier to handle and disassemble, reducing the necessary tools and techniques. Similarly, standardisation ensures that well-established and repetitive techniques can be used for the deconstruction and increases the likelihood of a larger demand for reuse (ISO, 2020; Dodd et al., 2021d).
Additionally, the circular economy model favours the use of renewable resources, the minimisation of hazardous materials and the integration of higher proportions of recycled and recovered content. Other targets within the present self-assessment method are concerned with these circular economy-related measures, namely Section 3.2.9 in Sustainability.
It has been estimated that decisions made at the design phase determine more than 80% of the environmental impact of products (COM, 2020). Therefore, promoting design practices that extend the service life of buildings, components, parts or materials, and foster reuse is an essential step of the paradigm shift towards the circularity model. This effort is expected to reduce embodied life cycle impacts and resource consumption, extending the functional use that can be obtained from the initial investment of resources (Dodd et al., 2021c, d).
4.2.7 High-level aesthetic acceptance
The experience of architecture and space by observers and users is possible thanks to the human sensory system. Although human perception is multisensory in nature, the dominant sense is vision, which means that people tend to perceive their surroundings primarily through images. Studies show that between one third and more than half of the cerebral cortex is involved in the processing of visual information, 12% in the processing of tactile information, about 3% in the processing of auditory information, and less than 1% is responsible for the processing of olfactory and gustatory information (Eberhard, 2007). Nevertheless, there is a growing awareness of the interconnectedness between the senses and their influence on how we perceive the built environment.
To achieve a high level of aesthetics in the built environment, the creation of buildings and spaces with desirable visual qualities and a positive impact on the sensory and cognitive user experience should be reinforced. Visual qualities are based on universal values identified by interdisciplinary architecture research and widely accepted realisation practices. Formal qualities include order, contrast, transparency and novelty, and their appropriate compilation has a positive impact on visual richness. Beauty is also associated with pleasant sensory experiences for users that go beyond a sense of comfort, defined by interior temperature, light intensity, ergonomics, and basic functionality, as assessed by the target of health and wellbeing (Section 4.2.4). Research on human sensory perception describes the process of interaction between the environment and the observer through cognitive, emotional as well as physiological responses influencing spatial behaviour. We have become accustomed to giving priority to visual judgements and perception in evaluations of the built environment, somehow building up its superiority over auditory, olfactory, or tactile impressions. However, it has been proven that there is a close relationship between multisensory architectural and spatial experiences and the wider wellbeing of users has been identified (Spence, 2020). Aesthetic experience is concerned with combining feelings of pleasure and satisfaction in a coherent and complete way, and it is intended to engage with all senses through a variety of architectural means. Material and technological innovations can enrich the sensory experience and provide interactive and engaging stimulation, but do not determine the overall value of the aesthetic experience of architecture (Mallgrave, 2018). The intellectual and emotional factor of the perception of spaces and buildings is not less important. The cognitive aspects enrich the aesthetic experience and thus support a beautiful built environment.
4.2.8 Spatial coherence in planning and design
The concept of coherence is based on a spatial quality that results from the complex interactions among various elements within an urban structure. Urban space quality relies on morphological interactions, with strong connections at lower scales forming module-like units such as streets and blocks. These lower-level modules connect with higher-level ones to form a coherent space within a larger context (Salingaros, 2000). Spatial coherence in urban design is central to the design of successful and vibrant cities. Integrating spatial interventions into the urban pattern while preserving local identity improves the overall quality of the urban fabric, contributing to a sense of place and fostering a lasting connection between people and their environment. It is also of great importance that the designed interventions address challenges and opportunities in a way that considers the interconnectedness and interdependence of regions and localities. Efforts in this direction are important for the promotion of a more balanced and sustainable territorial development (Rodríguez-Pose, 2018).
4.2.9 Preservation of natural and cultural heritage
Heritage embodies the accumulated creative achievements of the past, and its preservation represents a responsibility of contemporary society. The recognition and maintenance of heritage should be integral to any development strategy, ensuring its relevance for future generations amidst the ongoing changes of the present. Given the emotional connection between people and their environment, a sense of place is an important factor in motivating people to act on behalf of their heritage and context (SFoC, 2021). However, achieving a high level of aesthetics in the built environment does not just mean protecting built heritage, but also integrating its substance and values in planning and building. Ensuring a high-quality urban environment is essential for the cultural vitality, economic development, and social welfare of cities and regions (UNESCO, 2005).
The landscape plays an important role in enhancing the quality of life and contributes to the cultural heritage of regions. It is a product of the interaction of natural and human factors, shaping local cultures and contributing to the European identity (Council of Europe, 2005). Historic urban landscapes, as representations of landscapes in historic areas, carry traces of current and past social expressions. These areas, including their surroundings, should be seen coherently, with a specific character deriving from the interaction of their parts. Contemporary architecture, when integrated into historic environments, should encompass planned interventions such as new buildings, extensions, and conversions, all contributing to the management of the historic urban landscape.
4.2.10 Genius loci and sense of belonging
The sense of belonging, a cultural motivation that drives human collaboration in creative efforts, is closely tied to the establishment and development of settlements in specific places that have profound meaning and significance. This connection extends beyond communities to encompass monuments, works of art, and historical cities. Significance, as an intangible quality that is sustained by material resources and environmental context, indicates the importance of recognising and preserving heritage. Genius loci emphasises that new developments must respect the existing urban fabric and preserve its qualities and characteristics, so that the place remains recognised for its heritage value over generations. The aim is to maintain the spirit or essence of a place, by recognising and preserving its characteristic features, emotional identity (elements with deeper meanings and emotional connections for its inhabitants), and other aspects within a natural or constructed environment (Norberg-Schulz, 1980; Garnham, 1985; Jackson, 1994). Hereby environment pertains to the ambiance shaped by human activities within a structure and its surrounding natural landscape. Work on a specific space should commence with a thorough examination and consideration of the unique spirit that characterises that place. By employing a sensitive adaptation process (Fusco Girard and Vecco, 2019), the genius loci of an existing building and place can be safeguarded.
4.2.11 Aesthetic perception of buildings and spaces
The target addresses the understanding of aesthetic perception of buildings and spaces through comparison to actual styles and tendencies. In architecture, the concept of style is widely used as a typological tool, the result of critical reflection focused on establishing similarities between buildings. In this context, it provides a useful indicator of coherence in the built environment. It is worth recalling, however, that contemporary architectural practices and theories react vividly to changing economic, social and political conditions and are both global and local disciplines. Their susceptibility to change, as well as the lack of universally recognised aesthetic canons and rules, makes it difficult to propose a unique stylistic and formal typology of trends present in contemporary architecture. Regardless of the style, it is possible to identify certain characteristics of a building/space such as unity, order, contrast, transparency and novelty that provide users with a positive visual and aesthetic experience. The arbitrary support of a chosen style can be seen as exclusionary (Hopkins, 2014). Therefore, existing building assessment standards do not use references to any particular style, but one can find references to the idea of biophilic design. The WELL v2 Building Standard (IWBI, 2020) uses biophilic design as a qualitative and quantitative metric. The qualitative metric must incorporate nature, natural patterns, and nature interaction within and outside of the building. For the quantitative portion, projects must have outdoor and indoor biophilia, as well as water features. The Living Building Challenge standard identifies the need to seek solutions in architectural design to intentionally incorporate nature into the fabric of buildings through environmental features, light, natural shapes and forms (MHCLG, 2020).
4.3 Selection criteria and list of KPIs
The NEB dimension of Beauty is strongly multidisciplinary and encompasses various and multifaceted approaches to achieve the set targets (Section 4.2) and to analyse the main aesthetic and quality of experience values. Hence, the first phase of the development of the method has involved identifying the most important areas of the Beauty dimension. The focus areas have been mapped selecting key definitions to establish a conceptual framework, along with guiding questions, formulated to define relevant aspects to be rated and assessed.
In addressing these questions, a thorough review of existing policies, standards, guidelines, codes and well-established rating frameworks has been undertaken, leading to the identification of a comprehensive set of criteria and thresholds. Defining clear and measurable criteria to objectively assess aesthetic requirements has proven particularly challenging. Indicators and thresholds have been carefully selected to surpass national regulatory standards, aiming for best practices within the defined targets. This process initially yielded numerous potential indicators, which were subsequently rationalised, harmonised and condensed into a more manageable set by resolving duplications, interlinkages and overlaps among candidate indicators, including those from other NEB dimensions. The identification of these indicators has represented a pivotal step within the procedural framework. This set underwent testing on different case studies encompassing varying scales, contexts and project types. The results of these tests informed a second selection of indicators, which focused on their relevance, applicability and effectiveness.
This second stage has led to the final development of key performance indicators (KPIs), each one comprehensively evaluating a specific assessment target by combining interlinked indicators and metrics. The selection or exclusion of indicators was guided by their readiness and maturity, as well as their alignment with the NEB ambitions (European Commission, 2022). To this end, indicators were categorised as currently established and used within academia and industry, emerging indicators expected to be used in the near future, or novel ones which require more research to be regularly applied in the far future. Moreover, the ambitions of the NEB dimension of Beauty have been duly considered, namely to (i) (re)activate the qualities of a given context while contributing to physical and mental wellbeing, (ii) connect different places and people and foster a sense of belonging through meaningful collective experiences, and (iii) integrate new enduring cultural and social values through creation (European Commission, 2022). The final set of indicators underwent meticulous review and validation. The entire process has reflected a commitment to evidence-based development, ensuring that the developed KPIs are relevant, accepted, credible, easy to use, and robust, providing a structured framework for evaluating aesthetic and quality of experience aspects across diverse scenarios.
As a result of this process, the following key performance indicators have been developed for self-assessment within the Beauty (B) dimension:
B.1 Digitalisation in construction: the extent to which disruptive technologies are adopted, with a specific focus on the establishment of a collaborative working environment and the integration of digital technologies, premanufacturing and automation.
B.2 Quality of design and delivery: the extent to which high environmental performance and project quality are ensured through the engagement of actors with relevant experience and competencies, the responsible procurement of certified products, and the optimisation of the quantity of sourced materials.
B.3 Improving building resilience to extreme events: the extent to which the design considers the different natural and man-made hazards to which the project may be exposed, including the effects of climate change, ensuring that the building and its components are designed to resist them and that preparedness measures are taken to foster more effective emergency management and rapid restoration of project functionality post-disaster.
B.4 Ensuring occupant health, comfort and wellbeing: the extent to which the project design provides a healthy environment with adequate visual, thermal and acoustic comfort, supporting and promoting physical, social and mental health, and in which the users can easily cater to their needs, have a meaningful experience and thrive.
B.5 Improving accessibility of the built environment for everyone: the extent to which the project space is adjusted to a large and varied group of potential users regardless of their ability or background, enabling non-discriminatory accessibility and movement through, around and between spaces, conveying spatial information to support the identification and comprehension of the environment and presenting easily usable and operable elements.
B.6 Maximising durability and service life: the extent to which the service life of building elements and components is maximised through the selection of durable products, the implementation of design considerations that accommodate substantial changes in user requirements and needs, and the promotion of ease of disassembly, reuse and recycling.
B.7 Ensuring high level of aesthetic acceptance of buildings and spaces: the extent to which the design solutions support and promote a positive sensory experience, both visual and non-visual, allowing acceptance of architecture and space and leading to support for the social, cognitive and emotional development of users.
B.8 Providing spatial coherence in planning and design: the extent to which the project fits into its context, integrating the spatial transformation into its built and non-built environment, creating harmony, unity, and order, preserving, reusing or adapting existing spaces, including open ones, and ensuring compatibility with the surrounding setting.
B.9 Improving preservation of cultural and natural heritage: the extent to which cultural and natural heritage within the context of projects, including traditional cultivated landscapes and original, historic urban green areas, are protected and preserved for the benefit of present and future generations, maintaining their authentic character and visual integrity by adopting solutions that are aligned with best conservation principles, respectful of the heritage value and minimally invasive.
B.10 Maintaining genius loci and improving sense of belonging: the extent to which the emotional bond and attachment among community members is nurtured and the unique spirit of the place is identified and preserved, encompassing its characteristic features, the authenticity of the built and non-built environment, as well as all associated interactions and sense of identity, within the context of projects.
B.11 Understanding aesthetic perception of buildings and spaces through comparison to actual styles and tendencies in art and architecture: the extent to which the project including buildings and spaces presents clear distinctive features that allow categorisation according to specific styles and tendencies, based on their common linguistic form and cultural context, and features that provide users with a positive visual and aesthetic experience.
The KPIs together with the associated indicators and indicator weights (wB.i.j) are provided in Table 47. The same table presents also the field of application and consideration of indicators according to the project classification based on scale, type, main use and relevance to cultural heritage.
Additional information on each KPI is provided in Sections 4.4–4.14, including the rationale, background, calculation method, main actors involved, and input data needed for the evaluation. The calculation method addresses the evaluation of indicator scores, KPI scores and KPI performances classes according to Sections 2.2.1 and 2.2.2.
Table 47. Key performance indicators (KPIs) within Beauty.
| KPI1 | Indicator | Scale | Type2 | Main use | Cultural heritage3 | Weight (wB.i.j) |
| Digitalisation in construction (B.1) | Collaboration and information sharing (B.1.1) | Building/ Neighbourhood/ Urban | Newbuild/ Renovation | Residential/ Non-residential | Not affected | 0.5 |
| Premanufacturing and automation (B.1.2) | Building/ Neighbourhood4/ Urban4 | Newbuild/ Renovation | Residential/ Non-residential | Not affected | 0.5 | |
| Quality of design and delivery (B.2) | Competencies of design team and contractors (B.2.1) | Building/ Neighbourhood/ Urban | Newbuild/ Renovation | Residential/ Non-residential | Not affected | 0.3 |
| Responsible material sourcing (B.2.2) | Building/ Neighbourhood4/ Urban4 | Newbuild/ Renovation | Residential/ Non-residential | Not affected | 0.3 | |
| Compliance with material efficiency opportunities (B.2.3) | Building/ Neighbourhood4/ Urban4 | Newbuild/ Renovation5 | Residential/ Non-residential | Not affected | 0.4 | |
| Improving building resilience to extreme events (B.3) | Hazard characterisation (B.3.1) | Building/ Neighbourhood4/ Urban4 | Newbuild/ Renovation | Residential/ Non-residential | Not affected | 0.35 |
| Hazard resilient design (B.3.2) | Building/ Neighbourhood4/ Urban4 | Newbuild/ Renovation | Residential/ Non-residential | Not affected | 0.35 | |
| Consequence mitigation (B.3.3) | Building/ Neighbourhood4/ Urban4 | Newbuild/ Renovation | Residential/ Non-residential | Not affected | 0.3 | |
| Ensuring occupant health, comfort and wellbeing (B.4) | Indoor acoustic environment (B.4.1) | Building/ Neighbourhood4/ Urban4 | Newbuild/ Renovation | Residential/ Non-residential | Not affected | 0.25 |
| Lighting environment (B.4.2) | Building/ Neighbourhood4/ Urban4 | Newbuild/ Renovation | Residential/ Non-residential | Not affected | 0.25 | |
| Thermal comfort (B.4.3) | Building/ Neighbourhood4/ Urban4 | Newbuild/ Renovation | Residential/ Non-residential | Not affected | 0.25 | |
| Promotion of physical movement (B.4.4) | Building/ Neighbourhood4/ Urban4 | Newbuild/ Renovation | Residential/ Non-residential | Not affected | 0.25 | |
| Improving accessibility of the built environment for everyone (B.5) | Ease of circulation (B.5.1) | Building/ Neighbourhood4/ Urban4 | Newbuild/ Renovation | Residential/ Non-residential | Not affected | 0.33 |
| Safe wayfinding (B.5.2) | Building/ Neighbourhood4/ Urban4 | Newbuild/ Renovation | Residential/ Non-residential | Not affected | 0.33 | |
| Usability and operation (B.5.3) | Building/ Neighbourhood4/ Urban4 | Newbuild/ Renovation | Residential/ Non-residential | Not affected | 0.34 | |
| Maximising durability and service life (B.6) | Durability (B.6.1) | Building/ Neighbourhood4/ Urban4 | Newbuild/ Renovation | Residential/ Non-residential | Not affected | 0.3 |
| Design for adaptability (B.6.2) | Building/ Neighbourhood4/ Urban4 | Newbuild/ Renovation | Residential/ Non-residential | Not affected | 0.4 | |
| Design for deconstruction (B.6.3) | Building/ Neighbourhood4/ Urban4 | Newbuild/ Renovation | Residential/ Non-residential | Not affected | 0.3 | |
| Ensuring high level of aesthetic acceptance of buildings and spaces (B.7) | Visual experience of architecture and space (B.7.1) | Building/ Neighbourhood/ Urban | Newbuild/ Renovation | Residential/ Non-residential | Not affected | 0.6 |
| Multisensory experience of architecture and space (B.7.2) | Building/ Neighbourhood/ Urban | Newbuild/ Renovation | Residential/ Non-residential | Not affected | 0.4 | |
| Providing spatial coherence in planning and design (B.8) | Spatial coherence and urban cohesion (B.8.1) | Building/ Neighbourhood | Newbuild/ Renovation | Residential/ Non-residential | Not affected | 0.4 |
| Re-use of spaces and buildings (B.8.2) | Building/ Neighbourhood/ Urban | Newbuild5/ Renovation | Residential/ Non-residential | Not affected | 0.3 | |
| Green urban areas (B.8.3) | Building/ Neighbourhood/ | Newbuild/ Renovation | Residential/ Non-residential | Not affected | 0.3 | |
| Improving preservation of cultural and natural heritage (B.9)6 | Historical fabric preservation (B.9.1) | Building/ Neighbourhood
| Renovation | Residential/ Non-residential | Yes5 (statutory protection) | 0.6 |
| Integrated heritage landscape conservation (B.9.2) | Building/ Neighbourhood
| Renovation | Residential/ Non-residential | Yes5 (statutory protection) | 0.4 | |
| Improving preservation of cultural and natural heritage in renovated buildings (B.9.3) | Building/ Neighbourhood
| Renovation | Residential/ Non-residential | Yes5 (with cultural value, but without statutory protection) | 1 | |
| Maintaining genius loci and improving sense of belonging (B.10) | Sense of place harmony (B.10.1) | Building/ Neighbourhood/ | Newbuild/ Renovation | Non-residential | Not affected | 1 |
| Understanding aesthetic perception of buildings and spaces through comparison to actual styles and tendencies in art and architecture (B.11) | Cognitive experience (B.11.1) | Building | Newbuild | Residential/ Non-residential | No | 1 |
1 Although minimum KPI scores are not prescribed in the NEB self-assessment method, it is highly recommended that all KPIs reach the Acceptable performance class.
2 In the case of renovation projects, the evaluation of KPIs B.1, B.2, B.3, B.4, B.5 and B.6 overall focuses on the specific aspects of buildings and spaces that are affected by the proposed intervention works. However, when indicators and/or metrics address aspects that are not altered by the renovation works, their evaluation should consider the as-built state (i.e. condition before the intervention is set).
3 Yes: Indicator applicable only to cultural heritage; No: Indicator non-applicable to cultural heritage; Not affected: Indicator applicable irrespective of cultural heritage.
4 The assessment should focus on representative building attributes within the neighbourhood or urban scale project. The user may assess a building that can represent on average the different attributes (or integrates the most dominant ones) within the project. Alternatively, the user may perform multiple assessments corresponding to distinct building designs representative of the building stock. In the latter case, the indicator score is estimated as a weighted average, with the weights obtained from the relative occurrence of each building design (in terms of number of buildings, built area, or other features).
5 Additional conditions apply.
6 In the case of B.9, users must decide utilising either indicators B.9.1 and B.9.2, or indicator B.9.3, based on whether cultural heritage buildings/spaces are legally protected or not.
Source: JRC.
The KPI performance class scores (PCS) assigned to all KPIs of the Beauty dimension, as a function of the attained KPI performance class and KPI score (Section 2.2.3), are provided in Figure 46.
Figure 46. KPI performance class scores (PCS) in the Beauty dimension.

Source: JRC.
The Beauty dimension score (B) (Section 2.2.4) is evaluated according to Equation (125). The number of the considered KPIs (m) within the equation depends on the project classification according to scale, type and main use (reported in Table 47).
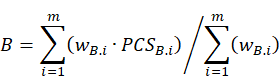
(125)
A variable weight (wB.i), reported in Table 48, is assigned to indicators, selectively modifying the weight provided in Equation (126).
![]()
(126)
Table 48. Beauty key performance indicator weights.
| Key performance indicator (KPI) | Weight (wB.i) |
| Digitalisation in construction (B.1) | 1 / m |
| Quality of design and delivery (B.2) | 1 / m |
| Improving building resilience to extreme events (B.3) | 1 / m |
| Ensuring occupant health, comfort and wellbeing (B.4) | 1 / m |
| Improving accessibility of the built environment for everyone (B.5) | 1 / m |
| Maximising durability and service life (B.6) | 1 / m |
| Ensuring high level of aesthetic acceptance of buildings and spaces (B.7) | (1 / m) · 1.5 |
| Providing spatial coherence in planning and design (B.8) | (1 / m) · 1.25 |
| Improving preservation of cultural and natural heritage (B.9) | 1 / m |
| Maintaining genius loci and improving sense of belonging (B.10) | (1 / m) · 0.25 |
| Understanding aesthetic perception of buildings and spaces through comparison to actual styles and tendencies in art and architecture (B.11) | 1 / m |
Source: JRC.
The Beauty dimension performance class is assessed considering the dimension score and dimension thresholds according to Figure 47.
Figure 47. Beauty performance classes and thresholds.

Source: JRC.
Most indicators and thus KPIs in the Beauty dimension are designed to be implemented at all project spatial scales, types and main uses (Table 47).
The evaluation of several indicators and/or metrics is affected by the project classification in terms of both project scale and type. When a project, classified into the neighbourhood or urban scale, involves several buildings with distinct design characteristics, thus likely leading to different indicator scores for each of them, the evaluation of the relevant indicator shall be carried out by identifying representative samples of buildings with similar design features. For each of them, a separate assessment shall be conducted. The overall average indicator score characterising the neighbourhood/urban-scale project is provided by weighting the evaluation of each specific typology by its relevance (e.g., number of occurrences) within the whole project. In the case of renovation projects, the assessment focuses on the specific aspects of buildings and spaces that are affected by the proposed intervention works. However, when indicators and/or metrics address aspects that are not altered by the renovation, their evaluation should consider the as-built state (i.e. condition before the intervention is set).
On a few occasions, apart from the project classification (scale, type, use), some additional conditions apply for the implementation of an indicator. For example, B.2.3 is applicable when new floor systems are constructed either in newbuild or renovation projects (e.g. as part of the interventions works. Accordingly, the indicator is omitted in renovation projects that do not intervene in the floor system. When a renovation project, classified into the neighbourhood or urban scale, includes buildings with modified floor systems and buildings without such modifications, the two cases must be assessed separately, as two distinct projects. This is the same approach as the one followed when a neighbourhood/urban scale project includes both types (newbuild, renovation) and/or uses (residential, non-residential) (Section 2.3.2). In all these cases the project should be assessed as multiple ones addressing separately the different classes (e.g. newbuild and residential; newbuild and non-residential; renovation and residential; renovation and non-residential) at the scale of the complete project.
Context influences B.3 regarding the definition of the hazards expected to affect the buildings. Specifically, the assessment is governed by the combination of hazard characterisation and hazard resistant design which has the most significant negative impact on performance. Context further affects the renovation of heritage buildings in B.9, for which alternative formulations are provided depending on whether statutory protection is enforced or not.
4.4 Digitalisation in construction (B.1)
4.4.1 Description and assessment
Under Digitalisation in construction KPI (B.1) the following indicators are assessed:
- Collaboration and information sharing (B.1.1): the extent to which the adopted information management processes establish a collaborative working environment and foster the integration of digital technologies.
- Premanufacturing and automation (B.1.2): the extent to which construction adopts premanufacturing and preassembly processes, and pursues automation.
B.1 score is evaluated as follows:
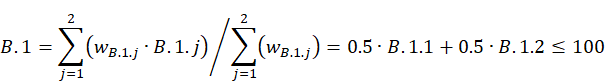
(127)
The first indicator (B.1.1) measures the level of digitalisation and coordination among all stakeholders from conceptual design phases to construction, operation, and deconstruction. B.1.1 is strongly related to the implementation of BIM practices. BIM is likely the most used digital technology in the construction sector. Its consistent application is expected to produce positive returns on investment, with reduction of overall projects costs and significant optimisation of time, resources allocation and waste production (ECSO, 2021). Moreover, BIM solutions play an important role in facilitating the integration of additional disruptive technologies and methodologies. These include VR/AR, data-model integration and IoT, digital twinning, parametric and generative design as well as other AI-assisted tasks, across the lifecycle of the building. These methods can help architects, engineers, and construction professionals to significantly streamline the design process and reduce resource consumption (Fonseca Arenas and Shafique, 2023; Guignone et al., 2023). Therefore, the integration of these methods within the design and management processes is positively evaluated.
The second indicator (B.1.2) places emphasis on advancing automation, fostering materials innovation and promoting efficiencies from off-site, near-site, and on-site premanufacturing and preassembly. These initiatives are anticipated to drive greater efficiency and yield more consistent, defect-free outcomes by standardising products as well as prioritising repeatable, digitally aligned, manufacturing-oriented methods over labour-focused approaches. However, the indicator does not aim to exclude traditional craft-based methods which constitute an important legacy of European cultural and constructive tradition and may add intrinsic value to the building. The proposed metric serves as a proxy for evaluating the extent of integration into the project of technologies collected under the term of Modern Methods of Construction (MMC), as defined within the framework established by the UK Ministry of Housing, Communities & Local Government (MHCLG, 2019).
Figure 48 provides B.1 KPI thresholds adopted in the self-assessment method.
Figure 48. B.1 performance classes and thresholds.

Source: JRC.
The KPI and its two indicators are designed to be implemented at all project scales, types and main uses (Table 47). The assessment of B.1.1 requires the identification of the main methods and technologies integrated within the project, therefore, it is not affected by the project classification (i.e. scale, type main use).
In the case of B.1.2, the evaluation is conducted through estimation of the costs for the complete Bill of Quantities (BoQ) and Materials (BoM) (Donatello et al., 2021) including manufacturing, logistic, transportation, site labour and preliminaries. To make and manage a harmonised estimate and classification of BoQ and BoM during the design stage, the Level(s) inventory template (Donatello et al., 2021) may be adopted. B.1.2 evaluation is affected by the project scale and type.
When a project, classified into the neighbourhood or urban scale, involves several buildings with distinct design characteristics, thus likely leading to different indicator scores for each of them, the evaluation of B.1.2 shall be carried out by identifying representative samples of buildings with similar design features. For each of these representative building designs, a separate assessment should be performed. The overall indicator score for B.1.2 is then estimated as a weighted average of the separate assessment scores, with the weights obtained from the relative occurrence of each building design.
For renovation projects, there are no significant alterations in the assessment compared to newbuild projects. B.1.1 addresses the level of collaboration among actors and the integration of other digital methods and technologies in the renovation project design. In B.1.2, the estimation of the construction costs for premanufacturing and automation indicator comprises manufacturing and installation of new elements, components, parts and materials, but also alterations and deconstruction of existing elements.
The evaluation of the KPI is expected to be performed by the design team, comprising architects, structural engineers and service engineers, potentially seeking the advice of product manufacturers, and main and specialist contractors to identify emerging technologies that are beneficial to the project and produce a correct estimate of costs. The evaluation requires the identification and collection of the building design plans, architectural and structural design drawings, service plans, BoQ and BoM for the whole building(s) or the renovated section of the building(s).
4.4.2 Collaboration and information sharing (B.1.1)
The collaboration and information sharing indicator is evaluated through a dimensionless score, which varies between 0 and 100 based on the BIM maturity stages outlined in PAS 1192-2 (BSI, 2013b) and the ISO 19650-1 (ISO, 2018c). This indicator measures the level of sophistication of the information management processes and the extent to which they establish a collaborative working environment.
As the size and level of complexity of a project grows, the number of involved parties increases. This includes, but is not limited to, clients, owners, operators and managers of the built asset, the design team, construction team and manufacturers delivering the projects, policymakers, regulators, investors, insurers and other external parties (ISO, 2018c). During the whole lifecycle of an asset, these actors produce, exchange and use asset and project information in different forms and with distinct purposes but with a particular order. Digitalisation of such information has been a key driver of collaboration and coordination among distinct disciplines involved in constructing or managing a project (Baldini et al., 2019). Information models are containers of such structured (e.g. geometry, schedules and databases) and unstructured digitalised information (e.g. documents, videos and sounds) related to the delivery phase (i.e. design, construction and commissioning) and operational phase (i.e. operations and maintenance) (ISO, 2018c).
Upon achieving full collaboration or full integration, the indicator rewards the inclusion of disruptive technologies within the design and management processes. The scores are assigned according to the rationale presented in Table 49. The sum of the points cannot exceed 100.
Table 49. B.1.1 score.
| Metric | Score1 |
| Select a single value from the metrics below: | |
Low collaboration Partial collaboration (BIM stage 1) Full collaboration (BIM stage 2) Full integration (BIM stage 3) | +10 +30 +50 +75 |
| If [Full collaboration or Full integration] has been selected, check the additional metrics below (multiple selections allowed): | |
[Full collaboration or Full integration] + Virtual or Augmented Reality [Full collaboration or Full integration] + Parametric or Generative Design [Full collaboration or Full integration] + IoT [Full collaboration or Full integration] + Digital Twin | +20 +20 +20 +20 |
| Indicator score = Σ (metric scores) | ≤ 100 |
1 If no metric value is satisfied in a single or multiple selection, the assigned score is zero (0).
Source: JRC.
Within the NEB framework, a project characterised by a low collaboration is considered low performing. This is, for instance, when there is no sharing of digital information resulting in the production of non-interoperable or paper-based documents. A low BIM maturity (i.e. BIM stage 1) is achieved when digital 2D and 3D information is generated by the individual parties and disciplines but is managed separately by all involved actors. In the case of low BIM maturity, partial collaboration is obtained with a limited exchange of data through the adoption of an online shared repository as a common data environment.
A medium BIM maturity (i.e. BIM stage 2) corresponds to a full collaboration across disciplines and specialities. The adopted information management processes are tailored to the specifics of the project and promote a strong collaborative working environment in which the production and exchange of data are coordinated between the parties. Not all the stakeholders operate on the same model. However, information produced through distinct discipline-based software, with different levels of interoperability, is exchanged in common file formats, producing a unified federate model compliant with the ISO 19650-1 (ISO, 2018c). This is stored in a single online shared repository, accessible, editable and maintained by all involved parties.
High BIM maturity (i.e. BIM stage 3) is a level in which deep collaboration among all project stakeholders is achieved through full integration of information into a single common shared model, which is centrally stored in a cloud-based environment. The structured database systems of the model are accessible, interrogable, and editable by all project participants, allowing them to work on and modify it simultaneously and in real time. This fully integrated information management process seamlessly follows the evolution of the project across each phase of its lifecycle, including design and construction, refurbishment, operations and maintenance.
Enhanced information management processes where agreed methods are adopted to produce standardised information with predetermined form, quality and delivery schedule, are expected to be beneficial to all involved parties, building a collaborative working environment (BSI, 2013b). Establishing a collaborative environment does not require additional work in terms of information generation and transfer, but implies mutual understanding and trust, as well as a high level of standardisation of the processes to ensure consistent and timely deliverables. Once effectively implemented, this approach ensures a beneficial reduction and anticipation of risks, in terms of costs, mistakes, delays and disputes among actors (BSI, 2013b; ISO, 2018c). BIM stands as the foremost method for generating and managing information models in the current market practices. BIM goes beyond the mere graphical description of the asset (BIM 3D) by incorporating layers of non-graphical information. This comprehensive approach facilitates scheduling and planning across all phases of the lifecycle, encompassing construction, operations, maintenance, and deconstruction. Furthermore, BIM extends its functionality to include the management of activities, costs, supply chains, energy and other critical resource consumption (Sacks et al., 2020). Therefore, higher BIM maturity is expected to result in an optimized quantity of generated information, tailored to specific uses and goals, to increase the reuse of this information and to mitigate the risk of data loss, inconsistencies and misinterpretations.
BIM has been shown to play a pivotal role in fostering the digital transformation of the construction sector, through the integration of other digital methods and technologies such as VR/AR, data-model integration and IoT, digital twinning, parametric and generative design. Recent developments highlight a clear shift away from static BIM models to digital twins that can help improve construction efficiency and reduce maintenance through virtual and augmented reality and IoT integration for continuous monitoring (Tuhaise et al., 2023). Digital twins can be employed to improve the quality and speed of decision-making, while significantly reducing errors. This enables rapid iterations and adjustments, resulting in innovative and refined designs. Digital twins can also help to identify and rectify errors early in the design phase, preventing costly mistakes and rework during construction and operation. By creating a real-time, virtual counterpart, digital twins provide a platform for rigorous analysis and simulation, enabling designers to assess the performance of construction materials and components under various conditions. This approach helps to identify potential flaws before they manifest in the physical world, leading to more robust construction practices and anticipating maintenance needs, which allows for timely corrections and mitigations (Opoku et al., 2021). An additional promising ability that digital twinning offers is dynamic life-cycle evaluation supported by past and present information. This allows an accurate end-of-life assessment that could be a key enabler for Circular Economy through component reuse (De Wolf et al., 2024; Brütting et al., 2019).
Parametric design and optimisation techniques are powerful tools to facilitate performance-based design as well as unlock innovative engineering and architectural solutions (Frangedaki et al., 2023). Through parametric design, a set of parameters and constraints can be varied enabling the rapid generation of diverse what-if scenarios that may lead to improved solutions in terms of key performance metrics (e.g. structural integrity, energy efficiency, and functionality) and may unlock innovative design concepts. Novel methods are emerging that make use of machine learning to reduce the computational time required for performance evaluation and behaviour prediction (Maureira et al., 2021; Asgarkhani et al., 2024), as well as mining and learning geometric and other key features that can be systematically encoded using knowledge graphs for the generation of new architectural and structural design (As et al., 2018; Płoszaj-Mazurek et al., 2020; Hayashi and Ohsaki, 2020). These approaches are particularly useful in conceptual design enabling AEC actors (e.g. architects, engineers) to focus on high-level performance targets (as defined in Section 4.2) that require an interdisciplinary and holistic approach.
Figure 49 shows the indicator thresholds used to link indicator scores with performance classes for B.1.1. While these thresholds and performance classes are not directly applied in the evaluation of KPI and dimension scores and performance classes, they are included here to assist users in determining appropriate performance levels for specific project aspects and to offer clear guidance on their improvement.
Figure 49. B.1.1 indicative performance classes and thresholds.

Source: JRC.
4.4.3 Premanufacturing and automation (B.1.2)
The premanufacturing and automation indicator is quantitatively evaluated through the premanufactured value (PMVa) of the assessed project (Cast, 2021). This dimensionless score varies between 0 and 100, for an increasing number of processes that are not executed on the final location on site. Despite its simplicity, PMVa has proven to be a good metric to quantify the trade-off between innovative and traditional processes, thus, it has been included into the UK Construction Sector Deal’s 2018 Implementation Plan as a primary measure for improvement in the construction industry (Cast, 2021).
PMVa is calculated as the ratio of the premanufactured product and material cost (PMC) to the gross construction cost (GCC), expressed as a percentage.
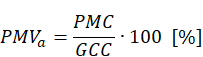
(128)
PMC comprises the cost of raw material, manufacturing (including factory overhead, running, labour, plant and equipment cost), logistic and transportation of components to site. GCC comprises PMC, preliminaries (from main contractor and sub-contractors) and on-site labour costs (Cast, 2021; CLC, 2018). In GCC, non-construction cost, such as marketing, is not considered. ‘Preliminaries’ comprise items and expenses necessary to fulfil the terms of the contract that are not allocated to a specific building element or component, such as cost associated with management, staff, site establishment, utility supplies, security, safety and control, insurances, bonds, guarantees and warranties (CLC, 2018). Premanufacturing processes may be conducted off-site, near-site or even on-site, as long as controlled conditions are ensured. As the design evolves from conceptual to detailed, the PMVa calculation may become more accurate, increasing the availability, granularity and reliability of the data (Jansen van Vuuren and Middleton, 2020). Upon the final definition of the BoQ and BoM, the PMVa can be further broken down for the specific elements, components, parts and materials (Cast, 2021).
Increasing PMVa in a project, thus reducing site labour and preliminaries intensity, is expected to enhance efficiency, predictability of the outcomes, productivity, quality, performance, speed, health and safety, while reducing waste, site overheads, cost, time and community disruption (Cast, 2021). Although no established methodologies exist to measure the level of construction automation, PMVa is considered an informative metric. Indeed, following the definitions of the MMC (MHCLG, 2019), structural and non-structural additive manufacturing, away from or even at the final location on site, is considered a controlled manufacturing process whose costs should be included in PMC. Whereas, innovative site-based construction techniques and robot-assisted operations, although falling outside main premanufacturing categories, improve site-based processes, reducing material wastage, site labour, supervision and overhead cost, thus leading to a higher PMVa (Cast, 2021; MHCLG, 2019).
In the construction sector, the use of computer-controlled machinery for additive manufacturing, laser cutting and 3D printing of buildings, elements and components is still premature. However, these technologies hold significant potential for offering greater geometric flexibility while improving quality and speed of completion (Baldini et al., 2019). Their evolution is strongly linked with robotics, which boasts a wide-ranging scope, especially in construction, maintenance and deconstruction phases (ECSO, 2021). The advancement of robotics has facilitated the portability of machinery and devices capable of executing various operations on-site, such as welding, casting, bricklaying, assembly or disassembly, either autonomously or under direct operator control (ECSO, 2021). Similarly to additive manufacturing, their adoption remains relatively limited, however, it is steadily increasing (ECSO, 2021).
Performance thresholds for PMVa may vary depending on the project scale. While some degree of onsite construction is typically required, such as for foundations, achieving complete automation and standardisation of processes is often hindered by the inherent diversity of products within the construction sector (Baldini et al., 2019). Experience in school projects, provided a qualitative three-level rating system with the medium class expected to have a PMVa above 50% and the high class exceeding 70% (Jansen van Vuuren and Middleton, 2020). A study on residential houses, categorised in low (5 storeys or fewer), mid (6 to 9 storeys) and high rise (10 storeys or above), indicates an expected baseline PMVa of 40%, and demonstrated that the implementation of premanufacturing processes and automation enables the attainment of target PMVa values ranging from 55% to 60%, independently of the building category (Cast, 2021). Following this rationale, the indicator for premanufacturing and automation (B.1.2) is evaluated from PMVa, according to Equation (129), which results in scores of B.1.2 = 40 for PMVa = 40%, and B.1.2 = 100 for PMVa ≥ 80%.
(129)
Figure 50 shows the indicator thresholds used to link indicator scores with performance classes for B.1.1. While these thresholds and performance classes are not directly applied in the evaluation of KPI and dimension scores and performance classes, they are included here to assist users in determining appropriate performance levels for specific project aspects and to offer clear guidance on their improvement.
Figure 50. B.1.2 indicative performance classes and thresholds.

Source: JRC.
4.4.4 Example (B.1)
In the following example a newbuild project type for residential main use is considered. The assessment is carried out at the building scale and no listed cultural heritage is affected by the project. During the delivery phase, the design team, comprising the architect, structural engineer and service engineers, focus on ensuring spatial coordination of the components realised off-site, simplifying their specification and manufacturing processes and preventing conflicts during assembly. Additionally, in collaboration with contractors and manufactures, the design team pursue an optimised planning and scheduling of the main construction processes, in terms of logistic, transportation and installation of premanufactured products as well as site labour. To achieve this, each party develops specific discipline models that are then integrated into a master model hosted in a shared common data environment. This full collaboration entails B.1.1 = 50.
As shown in Table 50, the total capital cost for the housing project is EUR 3 000 000. Of this cost, 33% is labour cost, and 18% contractor preliminary cost. Premanufactured cost is estimated to be 49% of the capital cost, due to the off-site production in a controlled factory environment for the columns, beams and floor slabs for the structural system, and external walling products, which are all assembled on-site. This value of PMVa corresponds to B.1.2 = 54. Accordingly, B.1 score is equal to 54 (Equation (127)), which corresponds to the Acceptable performance class (Figure 48) and a performance class score of 40 (Figure 46).
Table 50. Example of B.1 evaluation.
| Item | Value | Performance class |
| Collaboration and information sharing | Full collaboration | — |
| Capital cost | EUR 3 000 000 | — |
| Preliminaries | EUR 540 000 (18%) | — |
| Site labour | EUR 990 000 (33%) | — |
| Pre-manufacturing costs | EUR 1 470 000 (49%) | — |
| PMVa | 49% | — |
| B.1.1 | 50 | (Acceptable)1 |
| B.1.2 | 54 | (Acceptable)1 |
| B.1 | 52 | Acceptable |
| PCSB.1 | 40 | — |
1 Transformation of the indicator score to an indicator performance class is indicative and not required by the self-assessment method to estimate KPI and dimension scores and performance classes.
Source: JRC.
4.5 Quality of design and delivery (B.2)
4.5.1 Description and assessment
Under Quality of design and delivery KPI (B.2), the following indicators are assessed:
- Competencies of design team and contractors (B.2.1): the extent to which the project team has relevant skills and experience in delivering improved environmental performance and quality.
- Responsible material sourcing (B.2.2): the extent to which purchased construction products contribute to lower levels of negative environmental, economic and social impact.
- Compliance with material efficiency opportunities (B.2.3): the extent to which the design achieves more efficient use of material resources in structural elements.
In the general case when all indicators are considered, B.2 score is evaluated as follows:
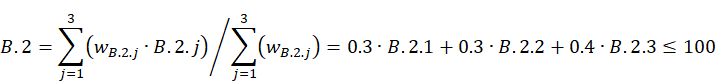
(130)
The first indicator (B.2.1) focuses on the competencies necessary to deliver an environmentally improved product. With respect to the requirements in a standard tender process, this criterion values experience in specific technical areas relevant to the sustainability of the final outcomes. This includes expertise in managing technical innovations and utilising multi-criteria green/sustainability or resilience certification schemes, given their increasing prevalence. A competent team is expected to select and specify solutions that align with environmental criteria. The criterion does not aim to exclude companies with less experience and rather encourages their participation in projects with high environmental performance requirements. The goal is to balance risks and foster the project success by ensuring that design and construction teams comprise experienced professionals.
The second indicator (B.2.2) shifts the focus from the procurement of services to the procurement of goods. It promotes the specification and purchase of products with responsible sourcing certification over similar products without certification. Embedding ecological aspects in procurement policies and practices is expected to contribute to sustainable development (ISO, 2017c) and this indicator measures the commitment of the involved organisations to the principles of responsible sourcing.
The third indicator (B.2.3) evaluates whether a project is overdesigned by assessing the quantity of sourced materials in structural elements, thus promoting the optimisation and reduction of embodied resources. Load-bearing systems typically contain an important part of the mass and carbon embodied into the building, which is becoming more relevant also in terms of carbon emissions due to the improvement in the reduction of operational carbon (Röck et al., 2020). Therefore, this indicator provides an evaluation of the structural resource use intensity in the adopted design solutions. To simplify the quantification of this indicator, only floor systems are considered since they typically embody most of the building mass (van der Lugt et al, 2023) and are subjected to well-known loading conditions that are not significantly affected by exogenous factors.
Figure 51 provides the B.2 KPI thresholds adopted in the self-assessment method.
Figure 51. B.2 performance classes and thresholds.

Source: JRC.
The KPI and its three indicators are designed to be implemented at all project scales, types and main uses (Table 47). The assessment of B.2.1 requires the identification of the main actors involved in the delivery and operational phases, therefore, it is not affected by the project classification (i.e. scale, type main use). B.2.2 and B.2.3 are evaluated from an estimation of the BoQ and BoM for the whole building (B.2.2) and the floor systems (B.2.3). To make and manage a harmonised estimate and classification of BoQ and BoM during the design stage, the Level(s) inventory template (Donatello et al., 2021) may be adopted. B.2.2 and B.2.3 evaluation is affected by the project scale and type.
For renovation projects, there are no significant alterations in the assessment compared to newbuild projects for B.2.2 that focuses on new products sourced for the proposed works. For renovation projects, B.2.3 is evaluated only when changes are made to the floor systems. Accordingly, when renovation projects do not include alterations to the floor system, B.2.3 is omitted according to Equation (131).
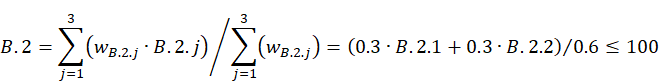
(131)
When a project, classified into the neighbourhood or urban scale, involves several buildings with distinct design characteristics, thus likely leading to different indicator scores for each of them, the evaluation of B.2.2 and B.2.3 shall be carried out by identifying representative samples of buildings with similar design features. For each of these representative building designs, a separate assessment should be performed. The overall score per indicator is then estimated as a weighted average of the separate assessment scores, with the weights obtained from the relative occurrence of each building design (in terms of number of buildings, built area, or other features). For example, when a neighbourhood/urban project includes multiple floor system types, B.2.3 is separately calculated for each system and the overall indicator score is determined as a weighted average of the different floor system scores, with the weights based on the area of each floor type as a percentage of the total gross internal floor area.
When a renovation project, classified into the neighbourhood or urban scale, includes buildings with modified floor systems and buildings without such modifications, the two cases must be assessed separately, as two distinct projects. This is the same approach as the one followed when a neighbourhood/urban scale project includes both types (newbuild, renovation) and/or uses (residential, non-residential) (Section 2.3.2). In all these cases the project should be assessed as multiple ones addressing separately the different classes (e.g. newbuild and residential; newbuild and non-residential; renovation and residential; renovation and non-residential) at the scale of the complete project.
The evaluation of the indicators is conducted by the design team, comprising architects, structural engineers, and service engineers, potentially seeking the advice of product manufacturers, main and specialist contractors, to ensure the traceability of products and materials across their supply chains (B.2.2) or identify feasible alternatives to optimise the design of the floor systems (B.2.3).
The assessment requires the identification and collection of the building design plans, architectural and structural design drawings, service plans, BoQ and BoM for the whole building or the renovated section of the building. For B.2.1, the CVs of the involved parties, official declarations and information related to relevant contracts in the previous years may be necessary to the self-assessor to carry out the indicator quantification.
4.5.2 Competencies of design team and contractors (B.2.1)
The competencies of design team and contractors indicator (B.2.1) is evaluated through a dimensionless score, varying between 0 and 100, based on the PPD (Directive, 2014) and the GPP (COM, 2008) project team competency criteria. The GPP criteria have been defined for office building design, construction and management; however, they are considered hereafter as generally applicable to any building type.
This indicator seeks to ensure that all parties involved in the delivery phase (i.e. design, construction and commissioning), and operational phase (i.e. operations and maintenance), have relevant competencies and experience in each of the technical areas that are relevant to their contractual obligations. Following the GPP approach, four main actors are considered separately due to their distinct roles, differences in the contractual relationships and required competencies: (i) project manager, (ii) architect, consultant and/or design team, (iii) main contractor and specialist contractors, (iv) design, build and operate (DBO) contractors and property developers.
The qualitative requirements for contract awarding envisaged by the PPD are categorised as: (i) suitability to pursue the professional activity, (ii) economic and financial standing, (iii) technical and professional ability. The evaluation of these qualitative requirements within a tender procedure is a complex task, often entrusted to a panel with sufficient knowledge and experience to assess competing contractors effectively. Moreover, specific criteria and minimum requirements may be set by national legislation, depending on the size and characteristics of the projects. Therefore, for the scope of the self-assessment tool, a simplified procedure is proposed.
The suitability to pursue the professional activity of any party involved is evaluated with membership in national professional or trade registers. A list of relevant registers and corresponding declarations and certificates is provided in Annex XI of the Directive on public procurement (Directive, 2014).
Requirements concerning economic and financial standing aim to ensure that actors have the necessary economic and financial capacity to execute the contract. The combined capacity of the actors involved is demonstrated, for self-assessment purposes, through a turnover ratio (i.e. ratio of the annual revenue to the expected annual contract value) at least unitary for the three financial years previous to the contract. Moreover, the actors should be protected against third-party claims through an appropriate level of professional risk indemnity insurance. On the other hand, technical and professional ability ensures that actors have adequate human and technical resources and experience to perform the contract to an appropriate quality standard. Combined compliance of the parties involved with these requirements is achieved by holding satisfactory experience of at least four works of a similar size, nature and complexity performed in the five previous years. Project similarity is evaluated in terms of the percentage of the estimated project value. Additionally, an adequate average annual manpower employed in the previous years and specific tools, plant and other technical equipment are necessary and at least one member of the project management or design team must have at least seven years of experience in delivering similar projects.
GPP shifts the focus of the assessment from the three classes of requirements to more environmentally related factors, defining two increasing levels of ambition. The core criteria aim to optimise the trade-off between capacity and economic investments, since the inclusion of green criteria typically entails higher upfront costs compared to standard solutions. Comprehensive criteria, instead, aim at higher innovation goals and more competencies are required. According to GPP, the actors should have relevant competencies and experience in each of the areas that are listed in Table 51, excluding the ones that are not relevant to the specific contract.
Table 51. Competencies and experience required of the main actors involved.
| Project manager | |
| Core criteria | Comprehensive criteria |
| Beside core criteria, project manager shall have relevant competencies and experience in each of the following:
|
| Design team | |
| Core criteria | Comprehensive criteria |
| Besides core criteria, architect, consultant and/or design team consortium shall have relevant competencies and experience in each of the following:
|
| Main and specialist contractors | |
| Core criteria | Comprehensive criteria |
| Besides core criteria, main and specialist contractors shall have relevant experience in each of the following:
|
| Design, build and operate (DBO) contractors, and property developers | |
| Core criteria | Comprehensive criteria |
| Besides core criteria, DBO contractors or property developers shall have relevant experience in management of design teams and/or main contractors to obtain ratings according to multi-criteria building assessment and certification schemes. |
Source: Adapted from Dodd et al. (2016).
In the case of design and build contracts, the design team employed should be assessed under the design team criteria. Additionally, when the DBO contractors or property developers operate as facility managers of the building, they shall have certified experience, such as ISO 50001 (ISO, 2018a) or equivalent, in implementing energy management systems (Dodd et al., 2016).
Given the aforementioned PPD and GPP criteria, the scores are assigned according to the rationale indicated in Table 52. The sum of the points cannot exceed 100. For the assessment, the presence in the project team of actors who meet any one of the exclusion rules defined in Directive (2014) automatically results in a value of 0 for the indicator.
Table 52. B.2.1 score.
| Metric | Score1 |
| Select a single value below: | |
| Project team comprises at least one actor meeting any of the exclusion criteria of Public Procurement Directive (PPD) (Directive, 2014) | B.2.1 = 0, No further points to be added. |
| No actor of the project team meets any of the exclusion criteria of PPD | Check next metrics |
| Select multiple values below: | |
| Project manager or design team is qualified and has economic and financial standing as well as technical and professional ability according to PPD. | +25 |
| Main or DBO contractors has suitability, economic and financial standing and technical and professional ability according to PPD. | +25 |
| Select a single value below: | |
Project manager meets GPP core criteria. Project manager meets GPP comprehensive criteria. | +15 +30 |
| Select a single value below: | |
Design team meets GPP core criteria. Design team meets GPP comprehensive criteria. | +10 +20 |
| Select a single value below: | |
Main or DBO contractors meets GPP core criteria. Main or DBO contractors meets GPP comprehensive criteria. | +15 +30 |
| Indicator score = Σ(metric scores) | ≤ 100 |
1 If no metric value is satisfied in a single or multiple selection, the assigned score is zero (0).
Source: JRC.
Figure 52 shows the indicator thresholds used to link indicator scores with performance classes for B.2.1. While these thresholds and performance classes are not directly applied in the evaluation of KPI and dimension scores and performance classes, they are included here to assist users in determining appropriate performance levels for specific project aspects and to offer clear guidance on their improvement.
Figure 52. B.2.1 indicative performance classes and thresholds.

Source: JRC.
4.5.3 Responsible material sourcing (B.2.2)
The responsible material sourcing indicator is quantitatively evaluated as the percentage of construction products from traceable and certified sources. Thus, the indicator varies between 0 and 100. The indicator aims at lowering the levels of negative environmental, economic and social impact, across the supply chain of products, including extraction, processing and manufacture, adopting sustainable development principles and practices in the provision, procurement and traceability of construction materials and components.
To eliminate the use of construction products originating from non-legal sources, a prerequisite of this indicator is that all components, parts and materials integrated in the building must be legally sourced. Failing to meet this requirement leads to a score equal to zero. This is particularly relevant for wood and wood-based products used permanently in the building, and temporarily during construction (e.g. formwork materials). These must be legally harvested and traded as demonstrated through certification schemes, such as those of the Forest Stewardship Council (FSC), the Programme for the Endorsement of Forest Certification (PEFC), the Forest Law Enforcement Governance and Trade (FLEGT), the European Union Timber Regulations (EUTR) or equivalent. Additional certificates may be needed in case of endangered species according to the Convention on International Trade in Endangered Species (CITES) (Dodd et al., 2016).
The BRE Environmental and Sustainability standard (BRE, 2016) provides a comprehensive framework for the assessment of sustainability aspects in the management and procurement practices of an organisation, defining a set of criteria with increasing performance levels. In the current absence of a European standardised method, an approach based on the supply chain management requirements reported in the BRE standard is adopted here as a transitional strategy for the assessment of the responsible material sourcing.
Based on the adopted approach, the assessment is conducted following the identification of the relevant building elements, components, parts, and materials, together with their respective quantities. Within the elements of BoQ, products are identified that are traceable through the supply chain and have an environmental management system in place. Quantities can be measured according to masses, volumes, or values, depending on the most appropriate measure for the assessed product. Consistency is crucial, and when the evaluation aims at driving the decision-making regarding multiple design solutions, the same measure should be consistently adopted in all alternatives.
In the self-assessment tool, products to be considered traceable and responsibly sourced require organisations involved at each stage of their supply chain, including raw material extraction and primary material production, to be certified by an accredited organisation according to ISO 9001 (ISO, 2024b). Moreover, such products must present an environmental management system certified by an accredited organisation according to standards such as ISO 14001 (ISO, 2024a), EU Eco-Management and Audit Scheme (EMAS), FSC and PEFC for wood and wood-based products, among others. Products and materials that are directly reused, fulfil responsible sourcing criteria even without a certification, whereas recycled and recovered ones require a certification for the reprocessing operations. In some cases, it is not possible to ensure the traceability across all the supply chain. In these cases, a possible future improvement of the assessment method consists in considering a different weight depending on the possibility of defining the certification of all or only the major aspects of processing, as currently adopted by some of the BREEAM ([1]) certification schemes.
Recommended thresholds for the percentage of construction products from responsible sourcing may depend on local, regional and/or national market factors (considering the scale of the project). Referring to wood and wood-based materials, GPP sets 25% as an easily achievable target and 70% as a more ambitious goal for public authorities (Dodd et al., 2016). The BRE Environmental and Sustainability standard (BRE, 2016), instead, sets three increasing levels at 60%, 75% and 90%. Considering these sources, Figure 53 shows the indicator thresholds used to link indicator scores with performance classes for B.2.2 in the NEB self-assessment method. While these thresholds and performance classes are not directly applied in the evaluation of KPI and dimension scores and performance classes, they are included here to assist users in determining appropriate performance levels for specific project aspects and to offer clear guidance on their improvement.
Figure 53. B.2.2 indicative performance classes and thresholds.

Source: JRC.
4.5.4 Compliance with material efficiency opportunities (B.2.3)
The compliance with material efficiency opportunities is quantitatively evaluated through a dimensionless score, based on the material weight per floor area, which is denoted as g (kN/m2). This ratio serves as a measure of ‘lightness’ of structures and anthropogenic (technosphere) mass flows.
Specifically, the assessment of B.2.3 focuses on the horizontal structural systems of buildings (i.e. beams and slabs). The influence of foundations, columns and walls is omitted. The design of these structural components depends significantly on a multitude of exogenous factors such as soil properties, ground water levels and expected actions, which would make the evaluation impractical. Importantly, floor slabs typically embody most of the building mass, estimated between 55 and 65% (van der Lugt et al, 2023), and thus offer a prime opportunity for resource optimisation. In addition, the design of floor systems, in most cases is based on established and well-known loading conditions that are not significantly affected from exogenous factors. Floor slabs are integral components of the structure, providing support for occupants, furnishings, and equipment. However, conventional floor slab designs may result in excessive material use, particularly in buildings with large spans or irregular shapes.
B.2.3 indicator aims at the adoption and implementation of strategies to ensure a reduction of material use in the horizontal structural elements. This, in turn, has a beneficial impact in terms of carbon emissions, resource consumption and energy embodied in the building. The estimation of embodied GHG emission into products and processes across the whole life cycle of the building is covered by S.3.2 indicator in the Sustainability dimension, complementing this indicator towards the efficient use of materials and resources.
Preliminary benchmarks have been collected from recent studies (Hart et al., 2021; Svatoš-Ražnjević et al., 2022; Belizario-Silva et al., 2024), which focused on the evaluation of superstructure systems for a variety of material options. Additional information was taken from a survey of 518 buildings (De Wolf et al., 2020), which reports material use intensity considering different structural systems. Since the identified thresholds are not well established, an independent investigation has been conducted for the development of this indicator.
According to this investigation, material usage estimation was carried out for reinforced concrete, timber, and composite floor slabs. Selected construction technologies for each construction material are briefly described in Table A. 1. The selection was based on the degree of maturity of the construction technology, ease of construction and common use in practice.
A multi-span sample area (28 · 21 m = 588 m2) and two different layouts for supports were considered, as illustrated in Figure 54. For reinforced concrete and composite slabs, spans of 7 · 7 m and 7 · 14 m were considered, respectively, while for timber slabs, the spans were reduced to 6 · 6 m and 6 · 12 m in line with existing construction technologies and good design practice (Schneider et al., 2024). For each construction technology, the slab self-weight along with additional permanent (g2) and imposed loads (q) were estimated. Loading scenarios with g2 + q ranging from 4 to 7 kN/m2 were considered as lower and upper bounds respectively, complying with the design prescriptions of Eurocode 1 – Part 1-1-1 (CEN, 2002a) for most residential and commercial buildings. Assumptions for the material properties were made for each slab configuration. The material designation intends not only to ensure effectiveness for each floor construction technology, but also reflect a typical implementation, avoiding material classes addressed to special structures. A minimum storey height of 2.6 m and a minimum structural fire resistance class of R60 (CEN, 2002b) were considered for all combinations of material, support layout and construction technologies.
Figure 54. Slab support layout: (a) A · B = 7 · 14 m for reinforced concrete and composite systems and A · B = 6 · 12 m for timber systems; (b) A · B = 7 · 7 m for reinforced concrete and composite systems and A · B = 6 · 6 m for timber systems.
(a) 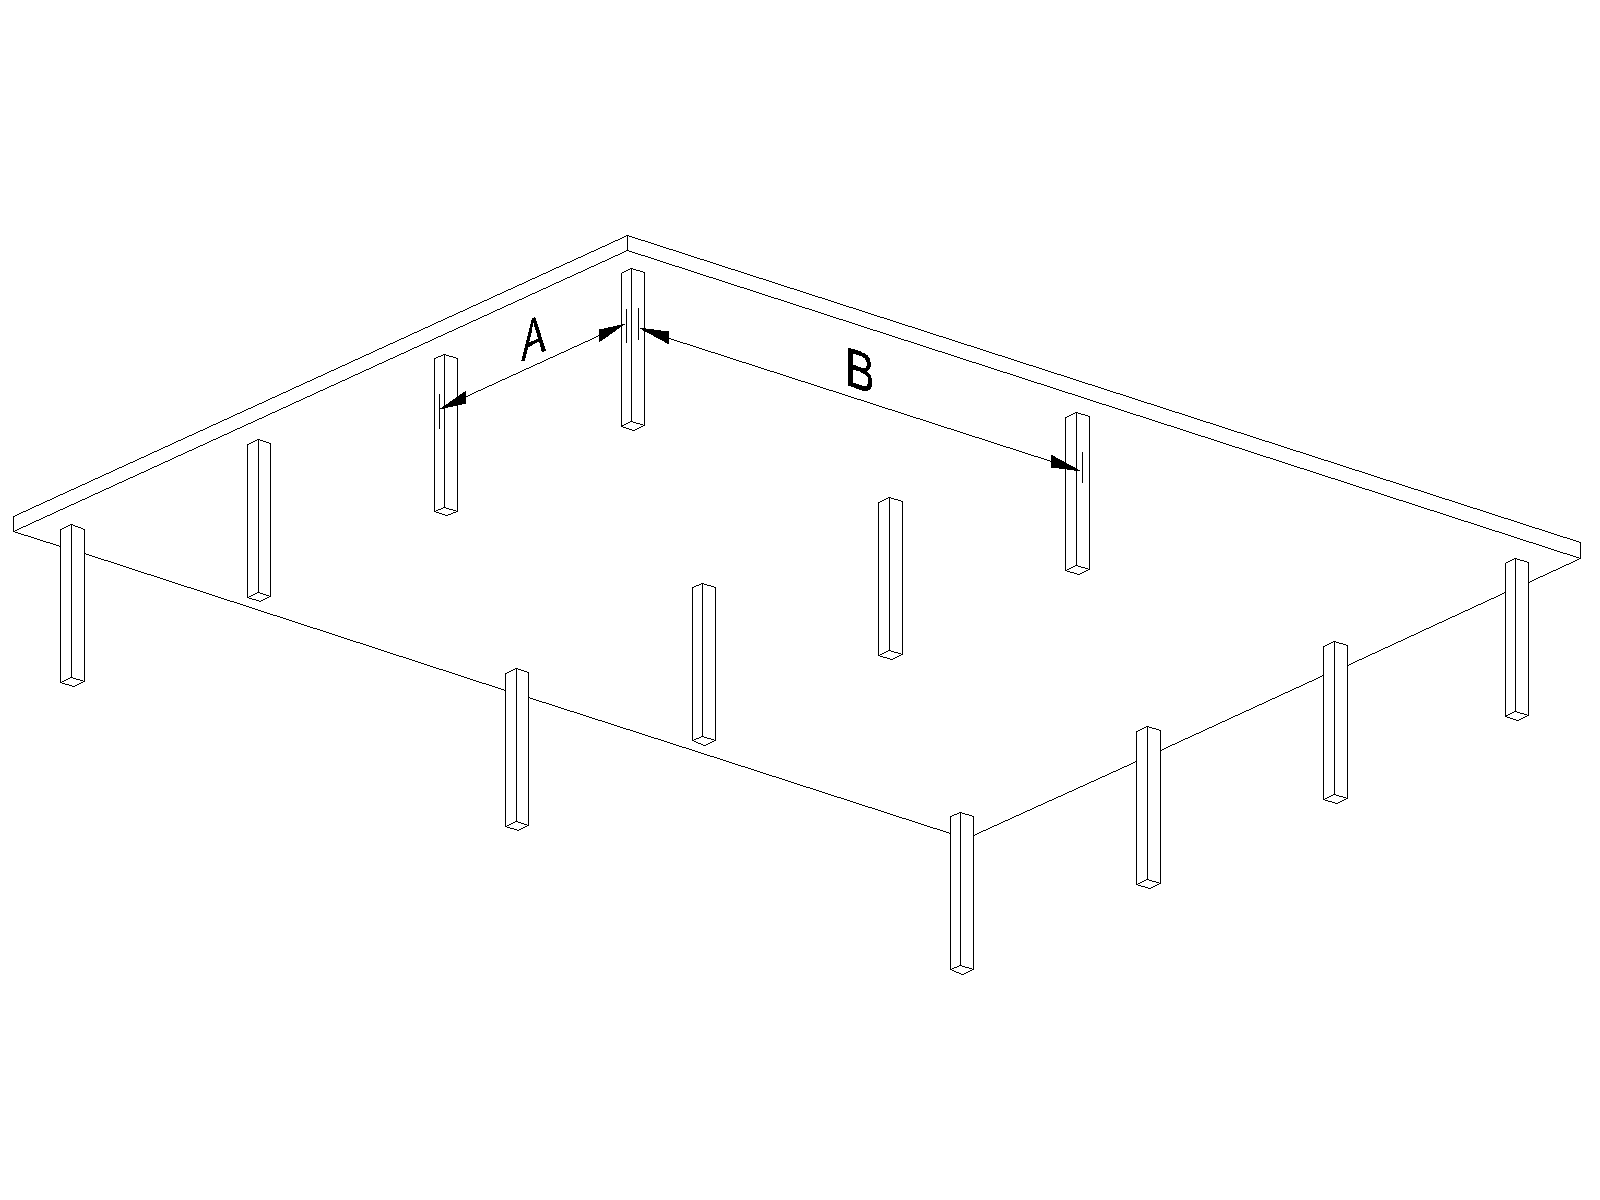 | (b) 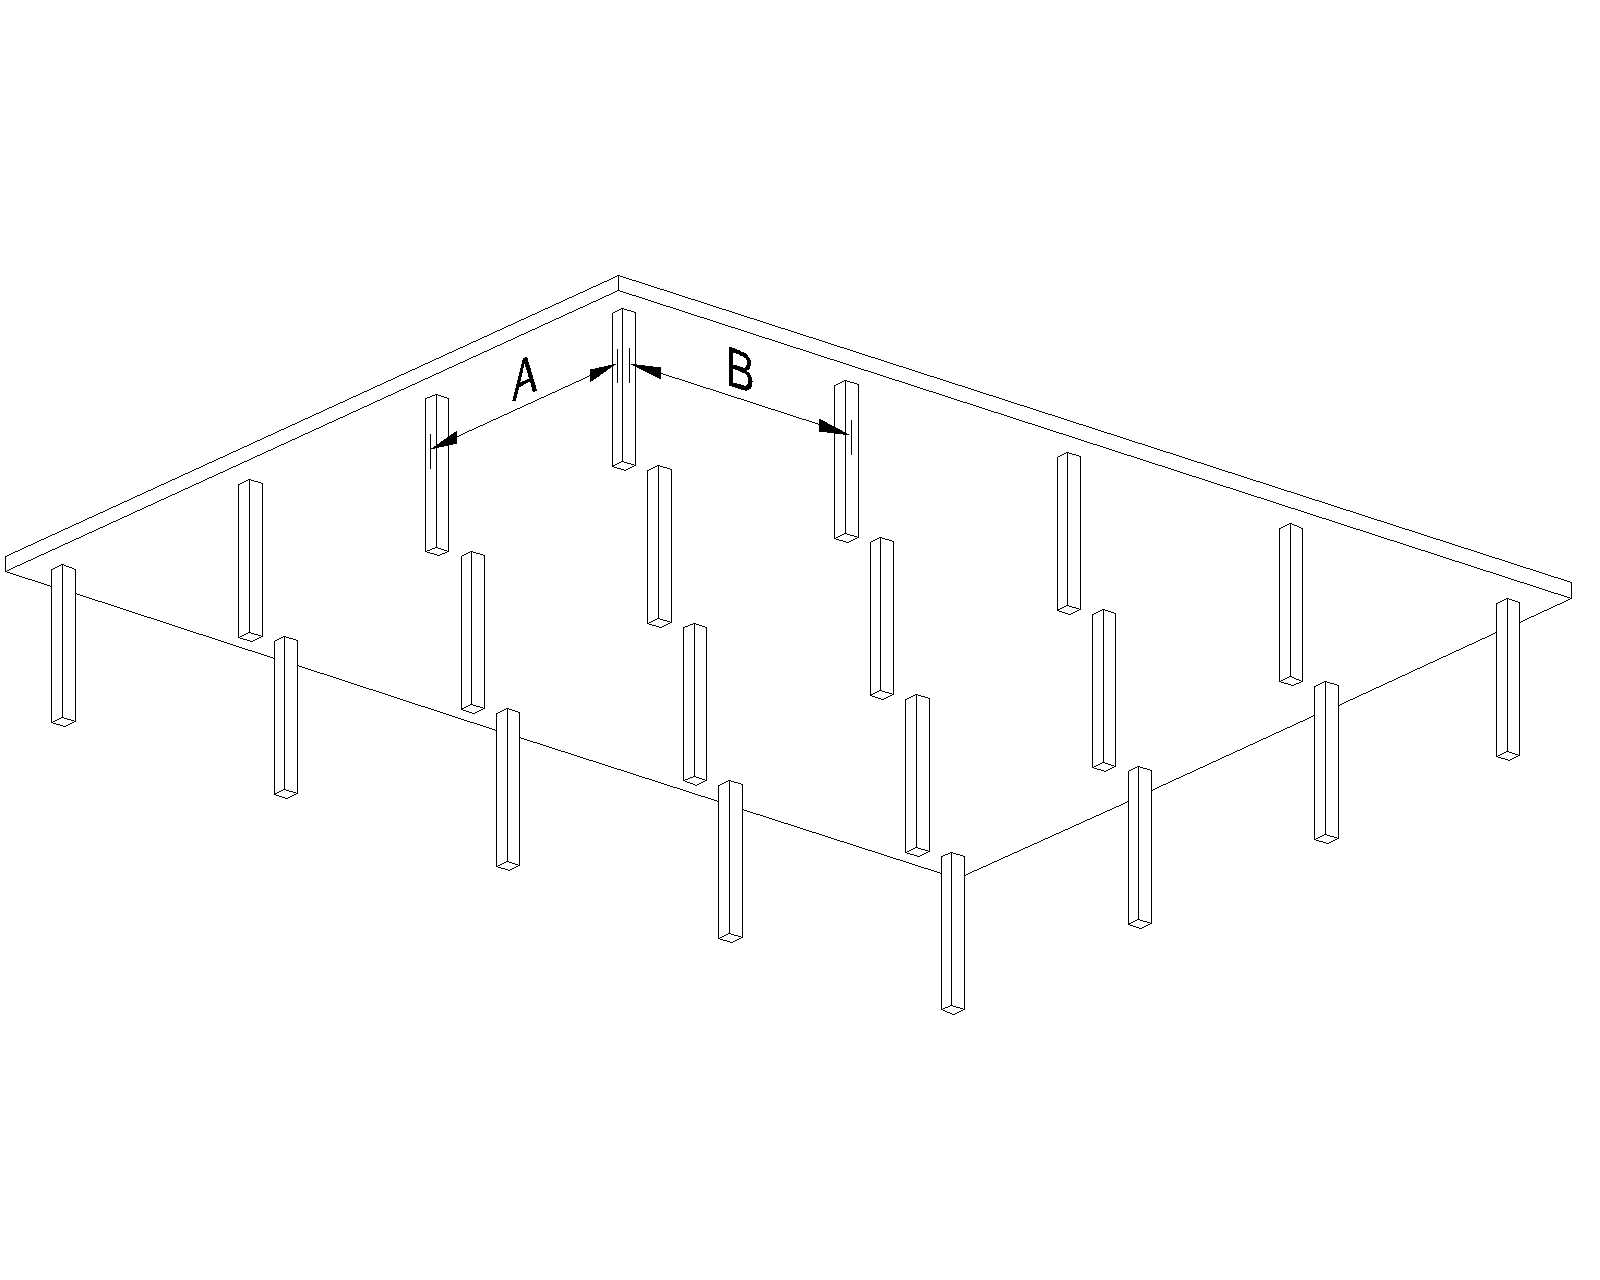 |
Source: JRC.
The investigation resulted in detailed maps of floor slab self-weight versus the employed construction technology and main span, as presented in the box plot of Figure 55 for reinforced concrete, Figure 56 for timber, and Figure 57 for composite floor systems. The floor slab cross-sections are detailed in Table A. 1.
Figure 55. Structural resource intensity for concrete slabs (C25/30, C50/60).
Self-weight g [kN/m2]
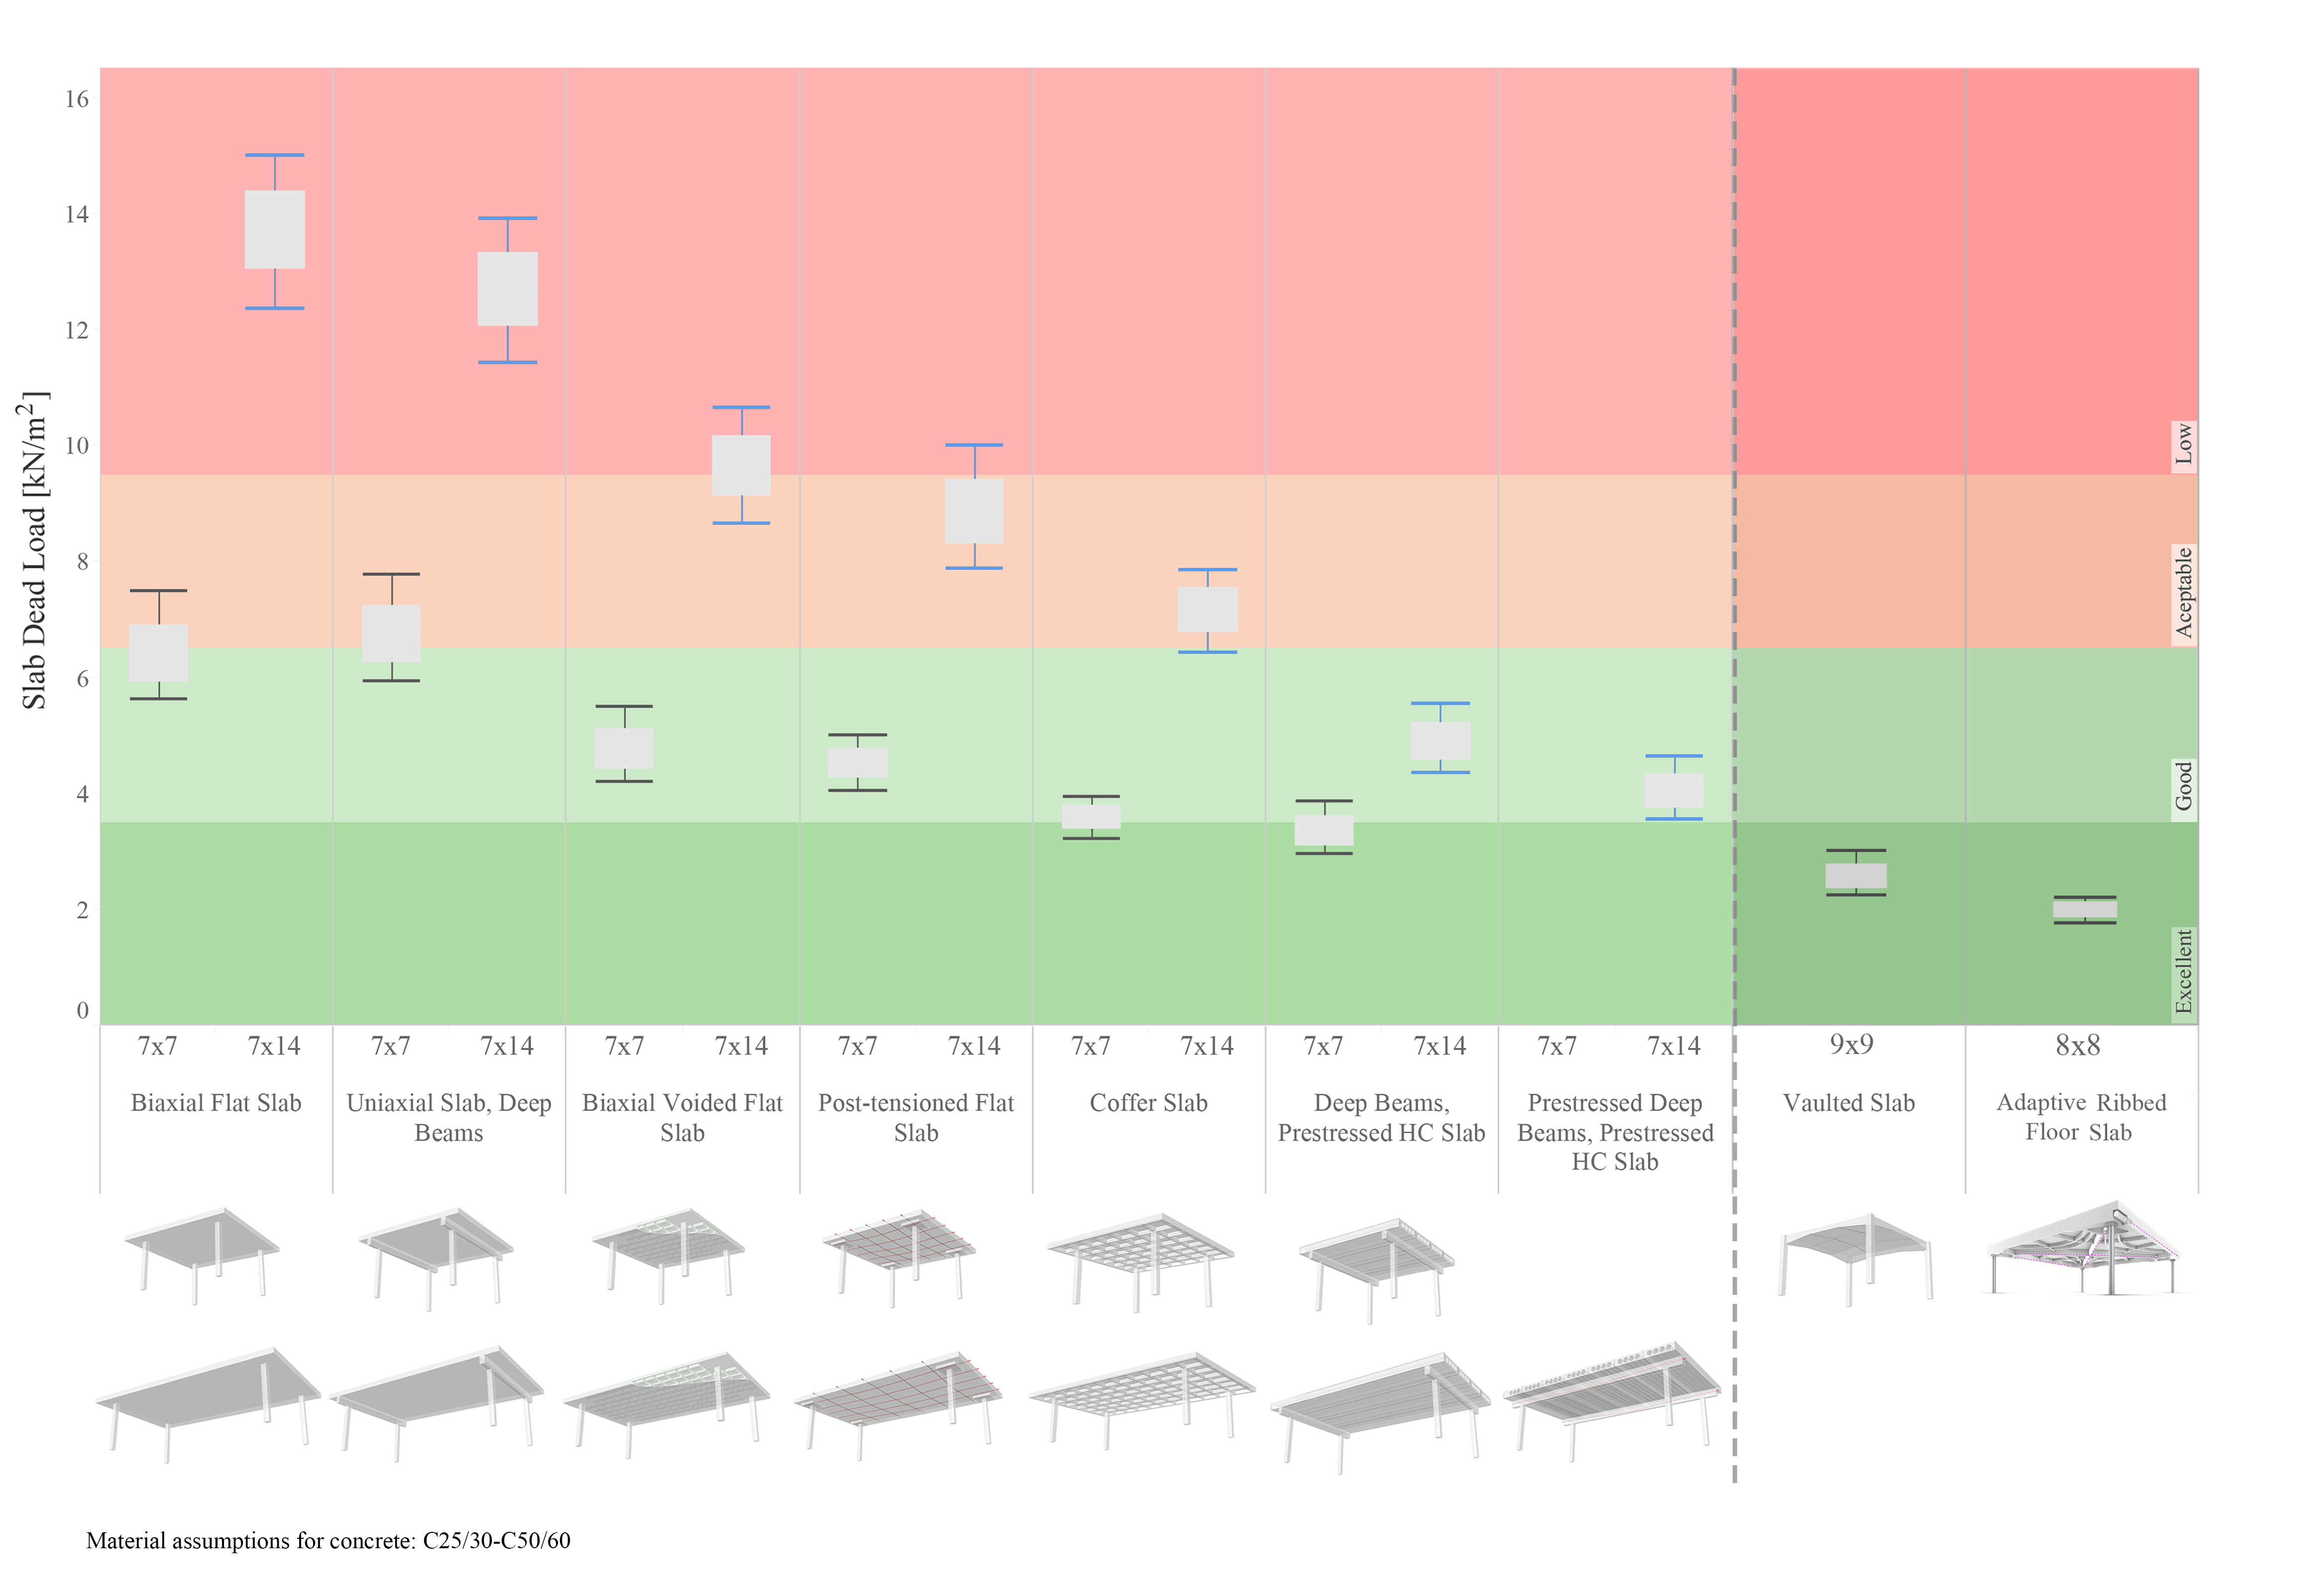
Source: JRC
Figure 56. Structural resource intensity for timber slabs (C24, GL24h, GL28h, LVL).
Self-weight g [kN/m2]
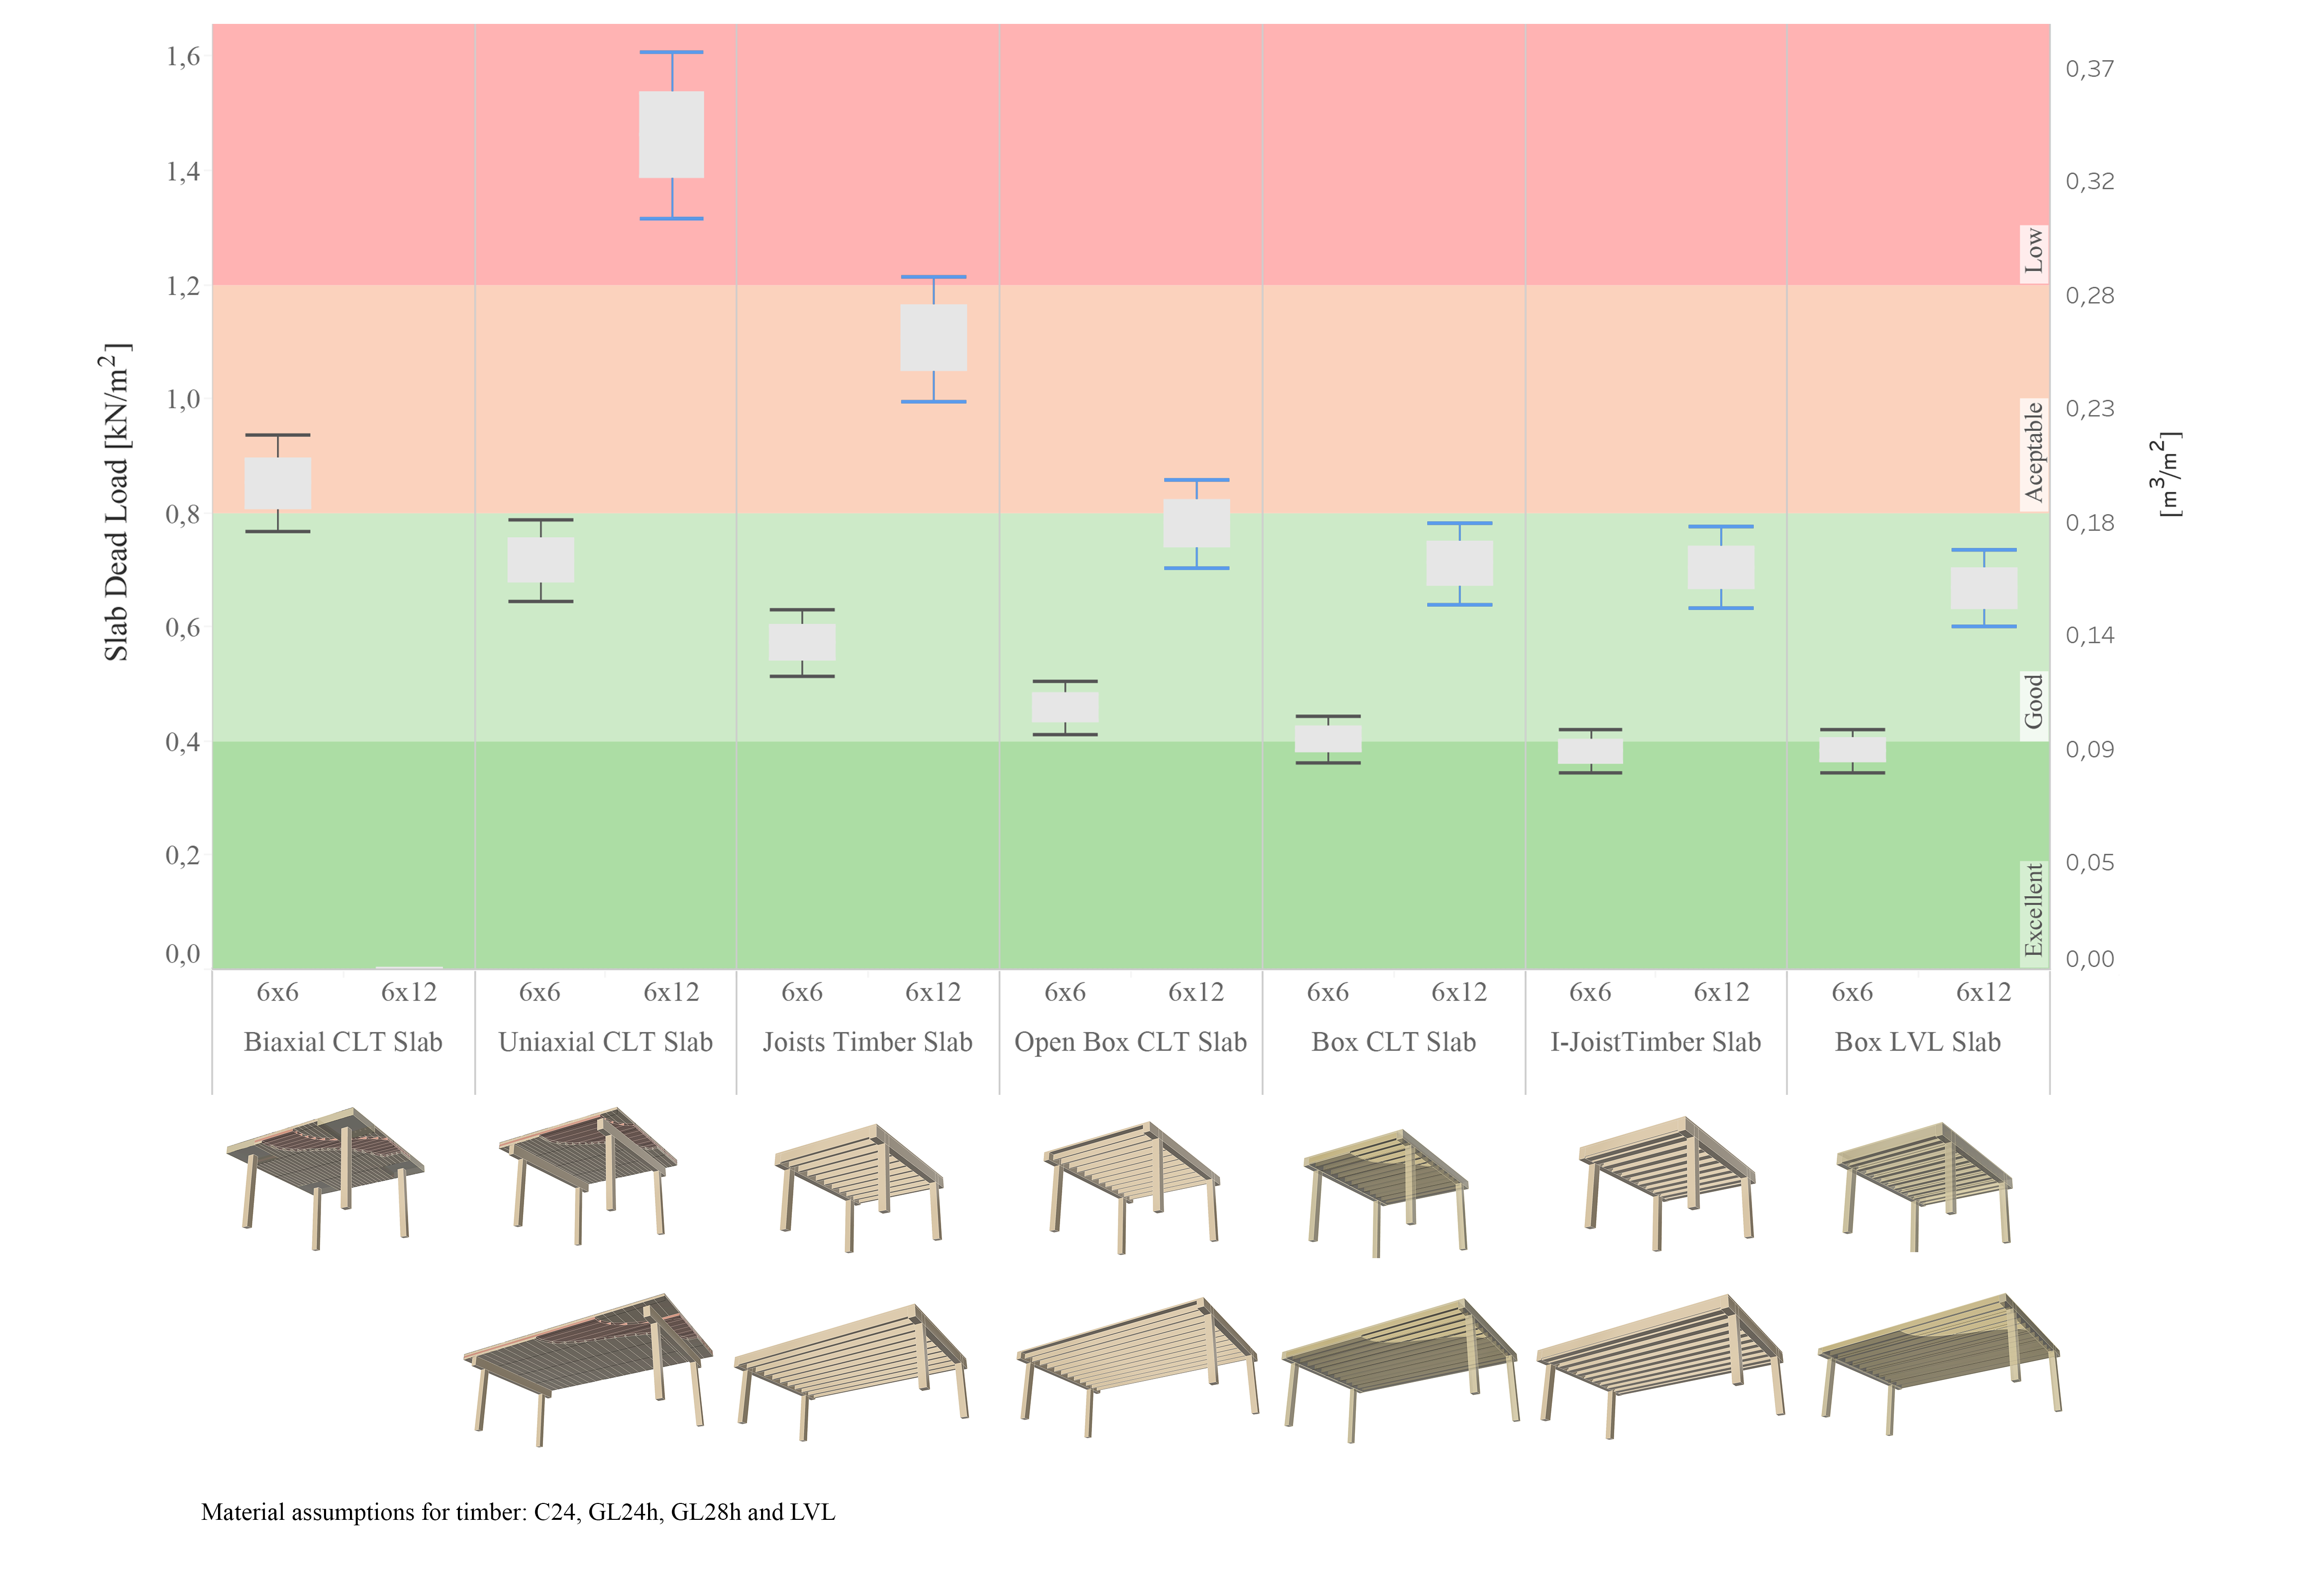
Volume / Area [m3 / m2]
Source: JRC
Figure 57. Structural resource intensity for composite slabs (concrete C25/30, C50/60; steel S235, S355; timber C24, GL24h).
Self-weight g [kN/m2]
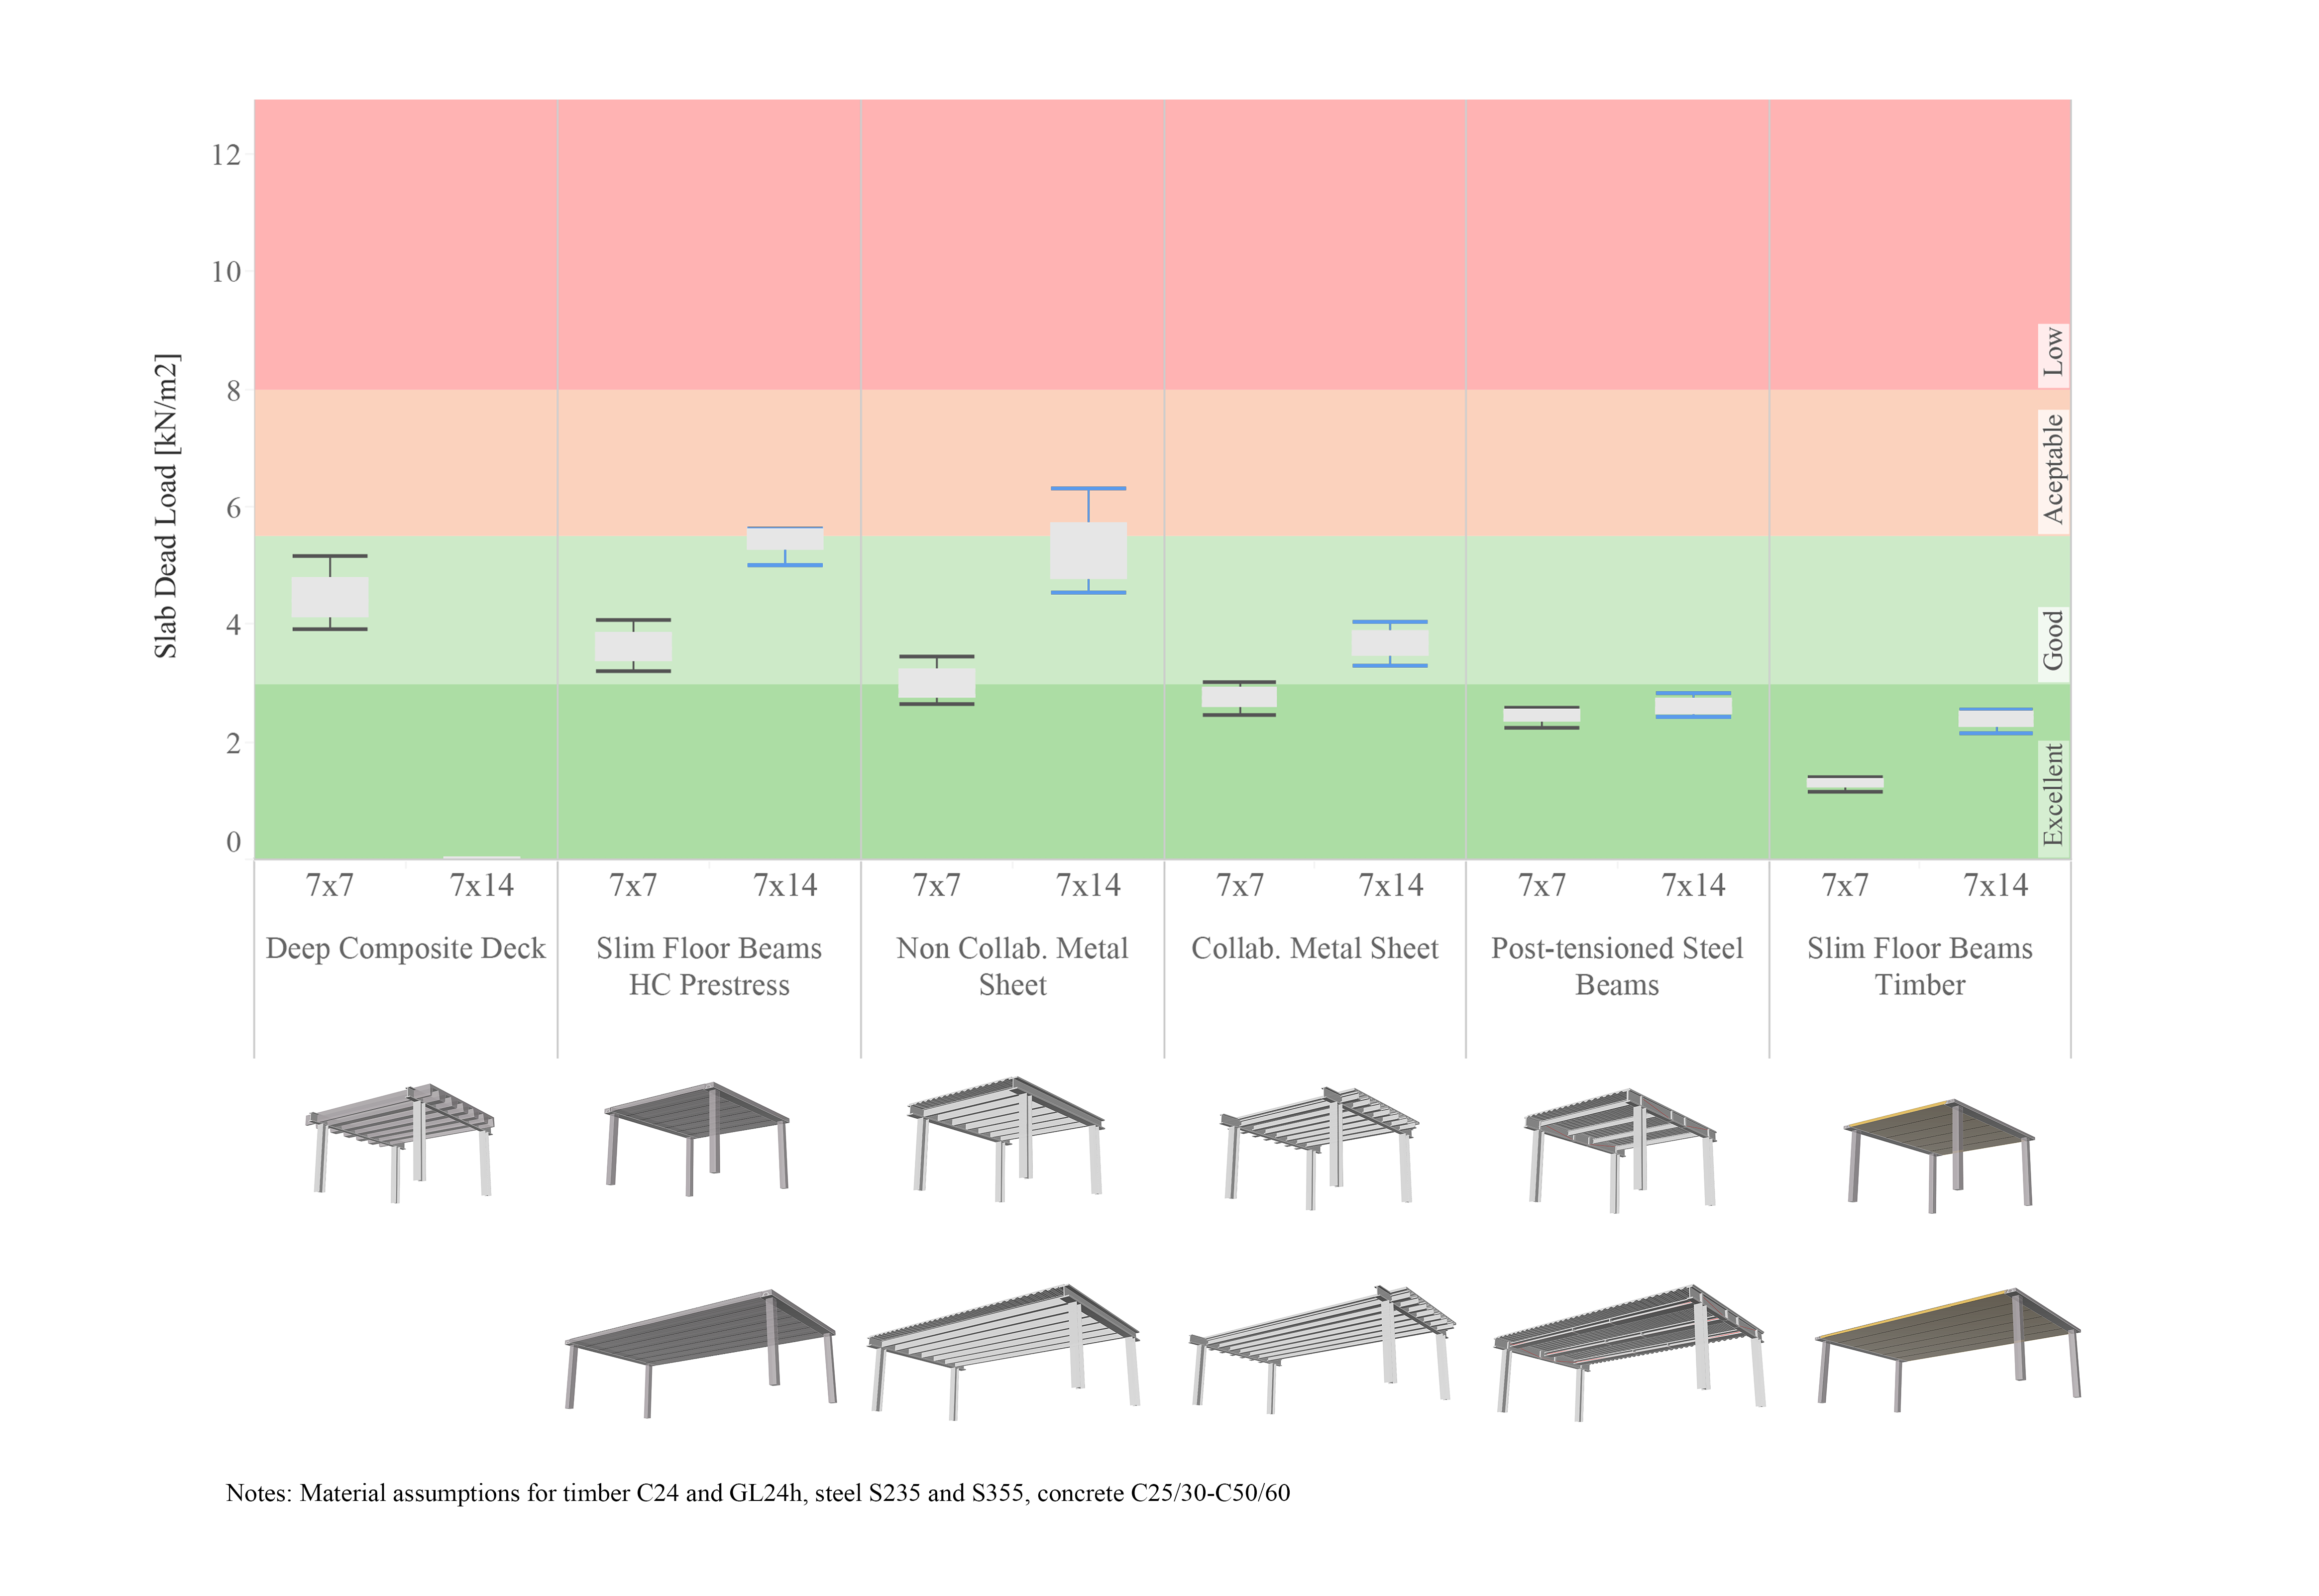
Source: JRC
For timber floor slabs, a metric of material volume per floor area (in m3/m2) is added as a secondary vertical axis, since it is commonly used in practice. However, B.2.3 score for self-assessment is based on the self-weight g. The conversion to material volume per floor area is approximate, considering a density of timber equal to 415 kg/m3 that is the average value of C24 timber (350 kg/m3) and laminated veneer lumber (LVL) (480 kg/m3).
For composite floor slabs, a homogenisation coefficient (a) was employed to convert the weight contribution of other materials to concrete-equivalent values. For a generic material, the homogenisation coefficient is given as:

(132)
where, E and ρ are the Young’s modulus and density, respectively, for a generic material (i) and concrete (c). Referring to the materials considered in this investigation, for concrete-timber composites, a takes values in the range of 1.9–2.5. The lower value was obtained using C50/60 concrete and LVL, while the upper value using C25/30 concrete and C24 timber. For concrete-steel composites, a takes values in the range of 1.8–2.2. Lower and upper bounds were obtained using C50/60 and C25/30 concrete, respectively. The steel Young’s modulus and density did not vary with the considered steel grades (i.e. S235 and S355). The concrete specific weight was set to 25 kN/m3 regardless of the class.
From the carried-out investigation, it is possible to identify lower and upper bounds of the slab self-weight g for each material, denoted as glb and gub, respectively. These correspond to the value of the performance classes Excellent and Low indicated in Table 53.
Table 53. Performance classes expressed in material weight g in kN/m2 for concrete, timber and composite floor systems.
| Low (gub) | Acceptable | Good | Excellent (glb) | |
| Concrete | g ≥ 9.5 | 9.5 > g ≥ 6.5 | 6.5 > g ≥ 3.5 | g < 3.5 |
| Timber | g ≥ 3.5 | 3.5 > g ≥ 2.2 | 2.2 > g ≥ 0.9 | g < 0.9 |
| Composite | g ≥ 5.0 | 5.0 > g≥ 3.75 | 3.75 > g ≥ 2.5 | g < 2.5 |
Source: JRC.
The score of B.2.3 is evaluated using a linear interpolation between the bounds, according to Equation (133). Lower and upper score bounds are B.2.3lb = 30 and B.2.3ub = 80, whereas the slab weight bounds are indicated in Table 53 for each considered material (glb, gub). Figure 55–Figure 57 may provide a range of g values as a function of the slab construction technology, main span and material at the early stages of design to evaluate alternative design solutions and improve the indicator score.
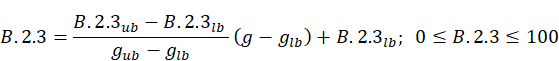
(133)
The indicator score bounds have been chosen so that the application of standard practice is expected to result in the Acceptable performance class (Figure 58). Thoughtful design choices in the support distribution and floor shapes enable efficient material use, when common and economical construction technologies are adopted. On the other hand, when programmatic and architectural choices favour large spans for functional reasons (i.e. to improve circulation, daylight penetration, etc.), high performance structural solutions become essential to minimise material consumption.
Higher performance classes can be achieved by employing more advanced design workflows that include parametric design and structural optimisation. Among innovative construction technologies that have a good potential are functionally graded concrete slabs, i.e. slabs with optimised gradient of porosity obtained by placing mineral void formers in the cross-section (Schmeer and Sobek, 2018). This can be thought of as an optimised variant of a voided biaxial slab using mineral void formers, which facilitates recycling compared to conventional solution using plastic void formers (Nigl et al., 2022). This technology has been applied to the design of the foundation and basement slabs of the new Large-scale Construction Robotics Laboratory (LCRL) at the University of Stuttgart (Haufe et al., 2024).
Vaulted floor systems (Hawkins et al., 2019) and rib-stiffened funicular floor systems (Rippmann et al., 2018) are innovative solutions that draw on experience of Gothic master builders, comprising double curved shells and post-tensioned ties between the slab corners to sustain the horizontal thrusts. These solutions are being reconsidered thanks to digital fabrication methodologies that ease construction feasibility of systems characterised by a more complex geometry than conventional flat slabs. Material savings exceeding 50% have been reported compared to conventional flat slabs (Liew et al., 2017).
An emerging approach to structural design involves the strategic integration of sensors and mechanical actuators to design structural systems that can counteract actively the effect of loads. The effect of actuation can be employed to redirect the stress from critically loaded components and reduce deformations. This approach is particularly effective for stiffness-governed design problems, e.g. tall and slender buildings, and long-span floor systems and bridges. Numerical and experimental tests have demonstrated that well-designed adaptive structures, including floor systems, can achieve material and associated emission savings exceeding 50%, compared to equivalent optimised passive solutions (Blandini et al., 2022; Reksowardojo et al., 2024; Senatore and Wang, 2024).
In the box plot map of Figure 55, emerging technologies for concrete slabs are reported on the right side of the dashed line. For vaulted floor systems, values are adapted from a structural design developed by ARUP and Laing O’Rourke on a 9 · 9 m layout (Scott, 2022). The adaptive ribbed slab is an experimental design developed at the University of Stuttgart that uses active tendons integrated in the ribs to counteract the effect of superimposed dead and live load (Reksowardojo et al., 2024). Further information about these systems is given in Table A. 1.
Figure 58 shows the indicator thresholds used to link indicator scores with performance classes for B.2.3. While these thresholds and performance classes are not directly applied in the evaluation of KPI and dimension scores and performance classes, they are included here to assist users in determining appropriate performance levels for specific project aspects and to offer clear guidance on their improvement.
Figure 58. B.2.3 indicative performance classes and thresholds.

Source: JRC.
4.5.5 Example (B.2)
In the following example a renovation project type for non-residential main use is considered, namely the structural design of a new multi-span 28.0 · 21.0 m concrete slab for an existing office building. The assessment is carried out at the building scale and no listed cultural heritage is affected by the project. A project team involved in the structural design of a multi-span 28.0 · 21.0 m concrete slab for an office building consists of the following members: (i) project manager; (ii) architect; (iii) civil engineer; (iv) main contractor.
All the parties are qualified to pursue the professional activity, as demonstrated by their enrolment in national professional or trade registers. The economic and financial standing is demonstrated through a ratio of the annual revenue of the involved parties to their annual contract value higher than one, in the last three years. Moreover, the parties are protected by professional risk indemnity insurances with an appropriate liability limit to provide coverage against claims for loss or damage in the specific current work. The technical and professional capacity of the team is demonstrated through participation in the previous five years in more than four works of the same nature and complexity and with values equal or greater than the value of the current project. Finally, the project manager has more than ten years of experience in delivering similar projects. These criteria are considered sufficient in the self-assessment to satisfy the PPD criteria (Directive, 2014) for both the design team (+25) and contractors (+25). Moreover, the project manager satisfies the comprehensive GPP criteria (+30), having experience in the design of environmentally efficient buildings, as demonstrated by works delivered in the previous five years, expertise in LCA analysis, and certification in well-established multicriteria rating schemes. Other members do not have any specific demonstrable competencies in green technologies, design or construction. Considering this consortium, B.2.1 equals 25 + 25 + 30 = 80 (corresponding to Excellent performance according to Figure 52).
Initially, the team designs a uniaxial slab (Design alternative 1, in Table 54). The slab is supported on beams and has spans of 7.0 and 14.0 m having a layout of column support as shown in Figure 54a. The design is carried out considering a permanent additional load of g2 = 2.0 kN/m2 and an imposed live load of q = 3.0 kN/m2. The design results in 300 m3 of concrete, expected to be cast in place.
60% of concrete (in terms of volume), including recycled materials, is purchased from organisations with a certificated environmental management system. Accordingly, B.2.2 score is equal to 60 (corresponding to a Good performance class according to Figure 53). The design solution is estimated to require a concrete usage per unit area of g = 12.7 kN/m2. Using Equation (133), B.2.3 score is given by:
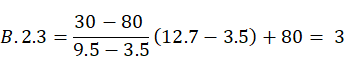 |
(134)
(achieving Low performance, according to Figure 58). From Equation (130), B.2 score is given by:
(135)
which corresponds to a Low performance class (Figure 51) and a performance class score PCSB2 = 0 (Figure ).
Then, the project team designs a second configuration (shown in Figure 54b), characterised by a point-supported flat slab with a 7.0 · 7.0 m column grid. For this configuration, the expected volume of concrete reduces to 150 m3. Considering the same percentages of responsibly sourced materials, B.2.2 is kept as 60, whereas the concrete usage per unit area reduces to g = 6.3 kN/m2, corresponding to a B.2.3 score of 57 (thus, a Good performance class). Combining the three indicator values, B.2 scores is equal to 65, corresponding to an Acceptable performance class and a performance class score PCSB2 = 40.
The flat slab solution with reduced column spacing performs well, however, the developer perceives a potential value decrease due to a lower space flexibility. The project team designs a third alternative solution with a bidirectional voided slab on 7.0 · 14.0 m bays (configuration shown in Figure 54a). Compared to the first solution, the expected volume of concrete reduces to 188 m3 (-37%), with a material usage of g = 8 kN/m2, corresponding to a B.2.3 score of 43. Keeping the same sourcing requirements for indicator B.2.2, B.2 score is found equal to 59, which corresponds to an Acceptable performance class and a performance class score PCSB.2 = 40.
Table 54. Example of B.2 evaluation.
| Item | Score | Performance class |
| Case study 1 | ||
| B.2.1 | 80 | (Excellent)1 |
| B.2.2 | 60 | (Good) 1 |
| B.2.3 | 3 | (Low) 1 |
| B.2 | 43 | Low |
| PCSB.2 | 0 | — |
| Case study 2 | ||
| B.2.1 | 80 | (Excellent) 1 |
| B.2.2 | 60 | (Good) 1 |
| B.2.3 | 57 | (Good) 1 |
| B.2 | 65 | Acceptable |
| PCSB.2 | 40 | — |
| Case study 3 | ||
| B.2.1 | 80 | (Excellent) 1 |
| B.2.2 | 60 | (Good) 1 |
| B.2.3 | 43 | (Acceptable) 1 |
| B.2 | 59 | Acceptable |
| PCSB.2 | 40 | — |
1 Transformation of the indicator score to an indicator performance class is indicative and not required by the self-assessment method to estimate KPI and dimension scores and performance classes.
Source: JRC.
4.6 Improving building resilience to extreme events (B.3)
4.6.1 Description and assessment
The Resilience to extreme events KPI (B.3) looks to evaluate the extent to which the project is resilient to the multiple hazards that can affect it, through the use of three indicators:
- Hazard characterisation (B.3.1): evaluates the reliability of the hazard estimates used in the project design, for all hazards that may affect the project.
- Hazard resilient design (B.3.2): evaluates the reliability of the approach used for the hazard resistant design of structural systems, and what measures are implemented by the design to limit damage and promote rapid recovery.
- Consequence mitigation (B.3.3): extent to which the project design implements measures in place to mitigate the consequences of extreme hazards on functionality and on the user community.
To evaluate B.3, the assessor must first identify which hazards can affect the project. In the NEB self-assessment method, the man-made hazards of fire and blast are considered, together with the following natural hazards: wind, floods (riverine and coastal), earthquakes, landslides, volcanic ash and tsunami. Volcanic hazards other than ashfall are not considered, as it is not safe, nor cost effective, to design buildings to resist other volcanic hazards, such as lahars. For the selected natural hazards, established methods for hazard intensity calculation and numerous hazard maps can be sourced in codes of practice and the global literature. Design codes and/or guidelines exist for design against the chosen hazards, even if not in all countries.
Table 55. Identification of hazards affecting the project.
| Hazard | Selection |
| Select man-made hazards of relevance to the project (multiple selections allowed): | |
| Wind | |
| Floods (riverine and coastal) | |
| Earthquakes | |
| Landslides | |
| Volcanic ash | |
| Tsunami | |
| Select man-made hazards of relevance to the project (multiple selections allowed): | |
| Fire | |
| Blast | |
| Total selections | n hazards |
Source: JRC.
B.3.1 and B.3.2 indicators are evaluated separately for each hazard according to adherence with best-practice design guidance, and beyond best-practice standards and guidance. B.3.3 is hazard independent and includes aspects of community and organisational preparedness, evacuation as well as considerations of project function continuity post hazard event. B.3 and the associated indicators can take values between 0 and 100. B.3 score is evaluated according to Equation (136):
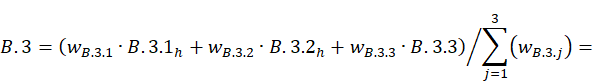
(136)
Equation (136) differs from the general form of Equation (2) with regard to the calculation of the first two indicators. Specifically, the values of B.3.1 and B.3.2 that enter Equation (136), correspond to the hazard (h) (among the n considered hazards of Table 55) that minimises the sum of the two indicators:
(137)
Finally, the performance class of B.3 is assessed, according to the thresholds in Figure 59.
Figure 59. B.3 performance classes and thresholds.

Source: JRC.
The KPI and its indicators are designed to be implemented at all project scales, types and main uses (Table 47). The KPI is influenced by the context regarding the identification of hazards expected to affect the projects. The assessment of B.3.1, B.3.2 and B.3.3 is affected by the project scale and type.
When a project, classified into the neighbourhood or urban scale, involves several buildings with distinct design characteristics, thus likely leading to different indicator scores for each of them, the evaluation of B.3.1, B.3.2 and B.3.3 shall be carried out by identifying representative samples of buildings with similar design features. For each of these representative building designs, a separate assessment should be performed. The overall score per indicator is then estimated as a weighted average of the separate assessment scores, with the weights obtained from the relative occurrence of each building design.
For renovation projects, the assessment focuses on the specific aspects of the building and spaces that are affected by the proposed renovation works. However, when indicators and/or metrics address an aspect that has not been altered by the renovation, their evaluation should consider the as-built state (i.e. condition before the intervention is set), as this contributes to the building resilience to extreme events.
The evaluation of the indicators within B.3 KPI is conducted by the design team, comprising architects, engineers and service engineers, seeking the advice of specialist engineers in hazard-resilient design, device manufacturers, main and specialist contractors. The assessment requires the following information to be identified and collected:
- Standards, guidelines and certification scheme documents, as well as any national standards relevant to hazard resilient design. International building codes and standards may need to be sourced if national codes and standards do not exist for a hazard deemed relevant to the project.
- Hazard maps and past hazard event footprints, for identification of hazards of relevance to the project site.
- Detailed information on the procedures followed by the design and engineering team for determining the hazard intensities at the site of the project.
- Detailed information on the design approach followed for the hazard-resilient design of the project.
- Plans of services and information on any back-up systems for water, electricity, gas, their capacity and location.
- Detailed plans of the buildings including information on storage of hazardous materials where relevant.
- Details of insurance policies for insuring against damage from hazards.
- Information on evacuation training of staff and users of the project, evacuation plans and drills.
4.6.2 Hazard characterisation (B.3.1)
The hazard characterisation indicator (B.3.1) evaluates the reliability of the hazard estimates used in the project design, for all hazards that may affect the project.
A value of B.3.1 is evaluated for each hazard i, among the n identified to be of relevance to the project (Table 55). These hazard-specific indicator values, B.3.1i, are retained for use in the calculation of B.3. The score for each B.3.1i cannot exceed 100. On some occasions, next to the metrics of the indicator, a “non-applicable” option exists, so that users can indicate that the specific metric is not relevant to the project attributes. If the non-applicable option is selected (when available), the full metric score should be considered in the evaluation of the indicator score, to avoid penalising a project due to non-relevant aspects.
Indicative performance classes for the indicator scores are provided in Figure 60. While these thresholds and performance classes are not directly applied in the evaluation of KPI and dimension scores and performance classes, they are included here to assist users in determining appropriate performance levels for specific project aspects and to offer clear guidance on their improvement.
Figure 60. B.3.1 indicative performance classes and thresholds.

Source: JRC.
Table 56 to Table 62 provide the score evaluation of B.3.1i score for all hazards. For natural hazards, the indicator B.3.1 focuses on the reliability of the estimated hazard intensity measure (IM) for the project. An IM is defined as a measurable characteristic of the hazard that can be used to calculate the forces and actions for the project engineering design. For example, wind speed is an IM, as it is a measurable characteristic of wind and is used in the calculation of pressures acting on structural components. Codes of practice can define one or more IM values for design, each associated with a different mean recurrence interval (MRI) (also called return period). MRI is representative of the average time between occurrences of the IM value at a site. Hence, a high MRI value corresponds to a rare hazard occurrence and a high IM value. Building codes use MRI to set limit states (or performance levels) for the design of buildings with different occupancy and importance. At a minimum, they define a high MRI (and associated IM) for the ultimate limit state design of a building. More commonly, modern hazard-related building codes recommend the explicit consideration of multiple limit-states and hence define multiple MRIs for the design (Fardis, 2013). For example, in Europe, Model Code 2010 (fib, 2012), EN 1998-1 (CEN, 2004) and draft of the next generation of Eurocode 8–Part 1, respectively define 4, 3 and 4 limit states for design against earthquake hazards. In the case of European building codes, some flexibility can be included to allow each EU member state to define the minimum number of limit states to be explicitly checked. Designers can, however, choose to adopt more performance levels than the minimum number defined in their national code. The number of limit states used in the project is relevant to the reliability of the hazard resilient design (i.e. to B.3.2, where design for more limit states results in a more reliable performance of the project against the hazard). However, as a consistent approach is used for estimating IM values at different MRI, the number of limit states used in the design is not relevant in the evaluation of hazard reliability.
In the design of a project, use of a single hazard event scenario for the determination of IM value (i.e. a deterministic hazard assessment) is not recommended, as it ignores the multiple hazard sources that may affect the project, and hence does not allow a reliable MRI to be associated with the IM value. For most hazard types, probabilistic hazard maps exist that provide IM estimates for given MRI values. These are based on probabilistic hazard assessments that account for multiple sources of aleatory and epistemic uncertainty in the IM estimation. Most modern codes of practice include such hazard maps, which are commonly developed by national entities, such as geological surveys or meteorological offices.
In general, an Acceptable performance class for B.3.1i can be achieved if the project design adopts hazard IM estimates derived from code-based hazard maps, e.g. seismic zonation and wind speed maps. However, for some hazards, such as floods, landslides, volcanic ash and tsunami, probabilistic hazard maps may not be available in building codes, as national building codes may not include these hazards in standard design practice. In such cases, probabilistic hazard maps from national entities or from reputable academic literature may be used in designs, leading to an Acceptable performance class. It should be noted that although probabilistic hazard assessment techniques are well-established for some hazards (e.g. earthquakes and wind), they are less well developed for other hazards (e.g. tsunami and landslides). Hence, the use of multiple deterministic hazard scenarios obtained from reputable scientific studies may also be adopted in the absence of any reliable probabilistic hazard studies. However, in the case of design for special structures (e.g. those with high occupancy, those used as evacuation shelters, or those providing critical services in the aftermath of a hazard event) the development of a bespoke probabilistic hazard assessment is desired.
For all hazards considered, higher indicator scores are obtained where bespoke data and hazard models are used in the IM evaluation. In the case of bespoke hazard models, it is expected that the topographical, bathymetric or urban arrangement features that are likely to increase the hazard intensity at a site are accounted for in the IM calculation. If they are not, a lower score will be obtained. Neglecting, in the IM calculation, specific mitigation measures (e.g. coastal defence, enhanced landslide drainage, etc.) in surrounding areas that may reduce the hazard intensity at the project site, is conservative. Hence, this is not included as part of the B.3.1i scoring criteria.
Physics-based models of the hazard can be used to develop probabilistic hazard assessments, and usually are used to simulate the value of an IM at a project site, the IM time history, and other characteristics of the hazard (e.g. other IMs). These physics-based models take different forms for the different hazard types. For example, for landslide hazard assessment, physics-based models are based on simple mechanical laws used to describe the physical processes leading to the landslide event and the resulting landslide characteristics (Pardeshi et al., 2013).
If the effects of climate change are likely to increase the hazard, then they should also be accounted for in the IM calculation to ensure the resulting design is resilient to future climate scenarios. A higher indicator score is therefore achieved if the IM estimates include climate change effects. Climate change projections are used as input to hazard models for floods and wind (e.g. Zscheischler et al., 2018). The Intergovernmental Panel on Climate Change (IPCC) publishes various scenarios for the Earth’s future climate and associated effects. The IPCC scenarios are widely used by the global climate change research community and are defined based on possible future trends in GHG emissions. IPCC presents the latest version of these scenarios, which include, for example: (i) the ‘ambitious’ scenario, with a climate policy aimed at reducing GHG, resulting in emissions declining to net zero by about 2075, and becoming negative after that (RCP2.6 or SSP1-2.6 scenarios in IPCC, 2022), (ii) the ’transition‘ scenario, with a climate policy aimed at stabilising GHG emissions, characterised by a slight rise in emissions before they decline after 2050, but do not reach net zero by 2100 (RCP 4.5 or SSP2-4.5 scenarios in IPCC, 2022), and (iii) The ‘business-as-usual’ scenario, whereby emissions rise steadily, doubling by 2050 and more than triple by the end of the century (RCP 8.5 scenario in IPCC, 2022. These scenarios of emissions provide the input parameters to large scale climate models (e.g. atmosphere-ocean general circulation models, see for example Wigley and Raper, 2001). The climate models are then downscaled to provide finer resolution data for IM assessment at the project site. The downscaling can be carried out either by using empirical relationships between global and regional climate models, or by using higher resolution regional climate models with boundary conditions taken from the larger scale models (Fowler et al., 2007). The downscaled models are used to simulate values for dynamic weather variables, from which the IMs are determined. The simulation is repeated at different time steps in the future (commonly up to 50 or 100 years in the future), to generate frequency exceedance curves for the IM (Cremen et al., 2022).
Extreme hazards can impact a project at the same time as other common hazard effects. Accounting for these in the design is important for the consideration of the full range of scenarios in the resilience assessment. A number of key guidelines, standards, databases and other indicator systems have been consulted to form the basis of B.3.1 indicator. These include ASCE (2020, 2022, 2023b), BAT-ADAPT (OID, 2020), Building Resilience Index (International Finance Corporation, 2023), European Soil Data Centre ([1]), FEMA (2007, 2011b, 2013, 2020), Florida Building Code (International Code Council, 2020), Government of Netherlands (2020), NASA global landslide catalog (NASA, 2019), REDi Floods (ARUP, 2023), REDi Extreme windstorms (ARUP, 2022).
In the case of the man-made hazards, designing for fire and blast does not necessarily require a reliable estimate of the hazard intensity. Instead, design approaches focus on promoting hazard avoidance, providing hazard containment, and limiting the likelihood of progressive failure within structures. In the evaluation of B.3, the values of B.3.1 for blast and fire should take on the same value as the scores achieved for B.3.2 for the respective hazards (Table 62).
Table 56. B.3.1 score for wind hazard.
| Metric | Score | Non-applicable1 |
| Select single value below: | ||
| A probabilistic hazard map from the national code of practice or from a reputable existing scientific study, is used for the intensity measure (IM) determination. | +20 | |
| A site-specific probabilistic hazard assessment is conducted (as per REDI Extreme windstorms ARUP, 2022, or equivalent) | Check next metrics. | |
| If [site-specific probabilistic hazard assessment] has been selected, select single value below: | ||
| The topographical, bathymetric or urban arrangement features that are likely to increase the hazard intensity at a site are considered. | +40 | |
| The topographical, bathymetric or urban arrangement features that are likely to increase the hazard intensity at a site are not considered. | +30 | |
| If [site-specific probabilistic hazard assessment] has been selected: | ||
| Wind-tunnel tests are conducted to verify the calculated effect of surrounding urban environment/topography on the IM. | +20 | |
| If climate change effects are considered, the IM values for different mean recurrence intervals (MRIs) are calculated through (multiple selections allowed): | ||
| Consideration of three climate scenarios (IPCC, 2022): (i) business-as-usual (RCP 8.5), (ii) the transition scenario (RCP 4.5), (iii) the ambitious scenario (RCP2.6). | +15 | |
| Downscaling through use of high-resolution climate models – site specific climate assessment. | +15 | |
| Use of mid-century climate projections (as defined in IPCC, 2022). | +5 | |
| Use of late-century climate projections (as defined in IPCC, 2022). | +10 | |
| The following co-incident hazards are accounted for in the load case scenarios used for design (multiple selections allowed): | ||
| Wind + snow accumulation + ice accretion. | +10 | ☐ |
| Wind + windborne debris2. | +10 | |
| Indicator score = Σ(metric scores) | ≤ 100 | |
1 If the non-applicable option is selected (when available), the full metric score is considered in the evaluation of the indicator score.
2 For windborne debris, simplified methods in codes of practice can be used to assess possible impacts.
Source: JRC.
Table 57. B.3.1 score for flood (coastal and riverine) hazard.
| Metric | Score |
| Select type of hazard assessment: | |
| Multiple deterministic hazard scenarios obtained from reputable scientific studies and/or past event observations are adopted for the intensity measure (IM) determination. | Check next metrics. |
| Hazard is assessed in a probabilistic context. | Check next metrics. |
| If [multiple deterministic hazard scenarios obtained from reputable scientific studies and/or past event observations], has been selected (single selection allowed): | |
| The project is classed as a special structure. | +0 |
| The project is not classed as a special structure. | +10 |
| If [hazard is assessed in a probabilistic context] has been selected (single selection allowed): | |
| A probabilistic hazard map from the national code of practice or from a reputable existing scientific study, is used for the IM determination. | +20 |
| A site-specific probabilistic hazard assessment is conducted. | Check next metrics. |
| If [site-specific probabilistic hazard assessment] has been selected, check the metrics below (single selection allowed): | |
| The hazard assessment is carried out using past observation data coupled with analytical (or simple) flood models. | +40 |
| The hazard assessment is carried out using past observation data coupled with numerical flood models (hydraulic models). | +50 |
| If [site-specific probabilistic hazard assessment] has been selected, check the metric below: | |
| Topographical, bathymetric or urban arrangement features that are likely to increase the hazard intensity at a site are accounted for. | +10 |
| Flood characteristics (and/or their time histories) that are relevant to the design are calculated (single selection allowed): | |
| Indirectly from the IM using a simplified procedure (e.g. ASCE, 2023a can be used to calculate velocities, wave heights, wave period, wavelength from the depth of coastal floods) | +10 |
| Through numerical modelling (hydraulic models) | +20 |
| Climate change effects on sea-level rise and precipitation are considered, and the IM values for different mean recurrence intervals (MRIs) are calculated through (multiple selections allowed): | |
| Consideration of three climate scenarios (IPCC, 2022): (i) business-as-usual (RCP 8.5), (ii) the transition scenario (RCP 4.5), (iii) the ambitious scenario (RCP2.6). | +15 |
| Downscaling through use of high-resolution climate models - site specific climate assessment. | +15 |
| Use of mid-century climate projections. | +5 |
| Use the late-century climate projections. | +10 |
| The following co-incident hazards are accounted for in the load case scenarios used for design: | |
| Flooding + debris1 | +10 |
| Indicator score = Σ(metric scores) | ≤ 100 |
1 Water-borne debris hazard assessment in Urban environment can be conducted as per ASCE/SEI 7-22 Supplement 2 (ASCE, 2023a) section 5.3.9.1.2, FEMA 543 (FEMA, 2007), FEMA P-55 (FEMA, 2011b), or other simplified approach.
Source: JRC.
Table 58. B.3.1 score for earthquake hazard.
| Metric | Score |
| Select single value below: | |
| A probabilistic hazard map from the national code of practice or from a reputable existing scientific study, is used for the IM determination. | +20 |
| A site-specific probabilistic seismic hazard assessment (PSHA) is conducted: | Check next metrics. |
| If [site-specific probabilistic seismic hazard assessment] has been selected, check the metrics below (multiple selections allowed): | |
| The hazard assessment is carried out using past observation data coupled with ground motion prediction equations (GMPE). | +40 |
| More than one GMPE is used. | +5 |
| Spatial correlation is accounted for (see Baker and Chen, 2020). | +5 |
| Physics-based earthquake ground-motion simulations (see Taborda and Roten, 2015) are used in the hazard calculation. | +50 |
| The topographical and geological features that are likely to increase the hazard intensity at a site are accounted for in the hazard calculation. | +10 |
| Response spectra and earthquake records used for the design (single selection allowed): | |
| Standard spectral shapes (uniform hazard spectra) associated with national codes of practice are used in the design and/or as targets for the selection of ground motions. | +10 |
| Conditional mean spectra (e.g. Baker, 2011) are defined from PSHA and are used for design or as targets for the selection of ground motions. | +15 |
| A selection of records is used from physics-based probabilistic seismic hazard assessment (see Bradley et al., 2015 for example). | +15 |
| The following co-incident hazards are accounted for in the load case scenarios used for design: | |
| An assessment of the liquefaction potential of soils at the project site is conducted. | +15 |
| Indicator score = Σ(metric scores) | ≤ 100 |
Source: JRC.
Table 59. B.3.1 score for landslide hazard.
| Metric | Score |
| Select type of hazard assessment: | |
| Multiple deterministic hazard scenarios obtained from reputable scientific studies and/or past event observations are adopted for the intensity measure (IM) determination. | Check next metrics. |
| Hazard is assessed in a probabilistic context. | Check next metrics. |
| If [multiple deterministic hazard scenarios obtained from reputable scientific studies and/or past event observations] has been selected (single selection allowed): | |
| The project is classed as a special structure. | +0 |
| The project is not classed as a special structure. | +10 |
| If [hazard is assessed in a probabilistic context] has been selected (single selection allowed): | |
| A probabilistic hazard map from a reputable existing scientific study, is used for the IM determination. | +20 |
| A site-specific probabilistic landslide hazard assessment is conducted: | Check next metrics. |
| If [site-specific probabilistic landslide hazard assessment] has been selected (single selection allowed): | |
| The hazard assessment is carried out using past observation data of landslide occurrence and size (see Guzzetti et al., 2005). | +40 |
| Physics-based landslide simulations are used in the hazard calculation (e.g. see Mercogliano et al., 2013). | +50 |
| Landslide characteristics (and/or their time histories) that are relevant to the design are calculated (single selection allowed): | |
| Indirectly from the IM using a simplified procedure or model. | +15 |
| Through numerical modelling of the landslide. | +25 |
| Climate change effects on precipitation are considered, and the IM values for different mean recurrence intervals (MRIs) are calculated through (multiple selections allowed): | |
| Consideration of three climate scenarios (IPCC, 2022): (i) business-as-usual (RCP 8.5), (ii) the transition scenario (RCP 4.5), (iii) the ambitious scenario (RCP2.6). | +15 |
| Downscaling through use of high-resolution climate models - site specific climate assessment. | +15 |
| Use of mid-century climate projections. | +5 |
| Use the late-century climate projections. | +10 |
| Indicator score = Σ(metric scores) | ≤ 100 |
Source: JRC.
Table 60. B.3.1 score for volcanic ash hazard.
| Metric | Score |
| Select type of hazard assessment: | |
| Multiple deterministic volcanic ash depth footprints obtained from reputable scientific studies and/or past ashfall events are adopted for the intensity measure (IM) determination. | Check next metrics. |
| Hazard is assessed in a probabilistic context. | Check next metrics. |
| If [multiple deterministic volcanic ash depth footprints obtained from reputable scientific studies and/or past ashfall events] has been selected (single selection allowed): | |
| The project is classed as a special structure. | +0 |
| The project is not classed as a special structure. | +10 |
| If [hazard is assessed in a probabilistic context] has been selected, select (single selection allowed): | |
| A probabilistic hazard map of volcanic ash depth from the national code of practice or from a reputable existing scientific study, is used for the IM determination. | +20 |
| A site-specific probabilistic volcanic hazard assessment is conducted using observational data on recurrence. | Check next metrics. |
| If [site-specific probabilistic volcanic hazard assessment] has been selected (single selection allowed): | |
| Empirical, analytical or simple numerical models (e.g. 1D models) for ashfall spread and deposition (see IAEA, 2016) are used. | +40 |
| Numerical ashfall spread and deposition simulations are carried out using wind field models with three dimensions and time (e.g. Hurst and Davis, 2017). | +50 |
| If [site-specific probabilistic volcanic hazard assessment] has been selected: | |
| The topographical, urban and geological features that are likely to increase the hazard intensity at a site are accounted for in the hazard calculation. | +10 |
| Climate change effects on wind are considered, and the intensity measure (IM) values for different mean recurrence intervals (MRIs) are calculated through (multiple selections allowed): | |
| Consideration of three climate scenarios (IPCC, 2022): (i) business-as-usual (RCP 8.5), (ii) the transition scenario (RCP 4.5), (iii) the ambitious scenario (RCP2.6). | +10 |
| Downscaling through use of high-resolution climate models - site specific climate assessment. | +5 |
| Use of mid-century climate projections. | +5 |
| Use the late-century climate projections. | +10 |
| The following co-incident hazards are accounted for in the load case scenarios used for design: | |
| Volcanic ash and rain. | +10 |
| Indicator score = Σ(metric scores) | ≤ 100 |
Source: JRC.
Table 61. B.3.1 score for tsunami hazard.
| Metric | Score |
| Select single value below: | |
| Multiple deterministic tsunami inundation footprints obtained from reputable scientific studies and/or past tsunami events are adopted for the intensity measure (IM) determination. | +10 |
| A probabilistic hazard map from the national code of practice or from a reputable existing scientific study, is used to determine the tsunami height at the coastline. | +20 |
| A bespoke probabilistic tsunami hazard assessment is conducted using numerical simulations (e.g. Salah et al., 2021) to determine the tsunami height at the coastline. | +40 |
| Inundation characteristics at the project site (i.e. runup, inundation depth, inundation velocity) are calculated from the tsunami height at the coastline using (single selection allowed): | |
| Empirical runup equations (e.g. McGovern et al. 2018), interpolated inundation depths, and inundation velocities evaluated from ASCE/SEI 7-22 chapter 6 (ASCE, 2022). | +10 |
| The Energy Gradeline Analysis (for inundation depth and runup estimation)1 and inundation velocity equations from ASCE/SEI 7-22 chapter 6. | +20 |
| Numerical inundation simulations1. | +30 |
| Climate change effects on sea level rise are considered, and the IM values for different mean recurrence intervals (MRIs) are calculated through (multiple selections allowed): | |
| Consideration of three climate scenarios (IPCC, 2022): (i) business-as-usual (RCP 8.5), (ii) the transition scenario (RCP 4.5), (iii) the ambitious scenario (RCP2.6). | +10 |
| Downscaling through use of high-resolution climate models - site specific climate assessment. | +15 |
| Use of mid-century climate projections. | +5 |
| Use the late-century climate projections. | +10 |
| The following co-incident hazards are accounted for in the load case scenarios used for design: | |
| Tsunami inundation + waterborne debris (as per the simplified approach in ASCE/SEI 7-22). | +15 |
| Indicator score = Σ(metric scores) | ≤ 100 |
1 Both the Energy Gradeline Analysis in ASCE/SEI 7-22 chapter 6, and numerical inundation models can take into account any amplifying effects of inundation from topography.
Source: JRC.
Table 62. B.3.1 score for fire and blast.
| Indicator | Score |
| If [Fire and/or blast] have been selected in Table 55: | |
| B.3.1Fire = | B.3.2Fire |
| B.3.1Blast = | B.3.2Blast |
Source: JRC.
[1] https://esdac.jrc.ec.europa.eu.
4.6.3 Hazard resilient design (B.3.2)
The hazard resilient design indicator (B.3.2) evaluates the reliability of the approach used for the hazard resistant design of structural systems, and what measures are implemented by the design to limit damage and promote rapid recovery. Indicative performance classes for the indicator scores are provided in Figure 61. While these thresholds and performance classes are not directly applied in the evaluation of KPI and dimension scores and performance classes, they are included here to assist users in determining appropriate performance levels for specific project aspects and to offer clear guidance on their improvement. A value of B.3.2 is evaluated for each hazard (i), among the n identified to be of relevance to the project (Table 55). The scoring system for each considered hazard is presented in Table 63 to Table 70, and the score for each B.3.2i cannot exceed 100. On some occasions, next to the metrics of the indicator, a “non-applicable” option exists, so that users can indicate that the specific metric is not relevant to the project attributes. If the non-applicable option is selected (when available), the full metric score should be considered in the evaluation of the indicator score, to avoid penalising a project due to non-relevant aspects.
Figure 61. B.3.2 indicative performance classes and thresholds.

Source: JRC.
Unlike some rating systems (e.g. Building Resilience Index for wind, International Finance Corporation, 2023), the design in the NEB method is not assessed against its performance under a recommended value of IM. Instead, scoring for the hazard resilient design indicator refers either to the national code of practice and/or international best practice code used for the project design. The indicator first seeks to evaluate whether and how the project meets or exceeds the performance criteria set out in the code. As stated in Section 4.6.2, many modern hazard-related building codes are performance-based and recommend that the performance of the project is checked at multiple hazard intensity values, each corresponding to a different MRI value (Fardis, 2013). For example, a code may specify that a building should sustain no damage to its structural elements when subjected to an IM value that occurs very frequently (i.e. at low MRI), and that collapse is avoided for IM values that occur very infrequently (i.e. MRI is very high). The use of performance-based design allows for a more tailored approach, whereas it is needed where prescriptive guidance is not available (e.g. for special structures), and it allows implementation of new technologies. The minimum MRI values associated with each limit state can be defined differently for structures with different functions, importance and occupancy. For example, for a given performance objective, the MRI value assigned to a hospital (which should remain operational after an extreme hazard event) is higher than for a normal residential building. As a consequence, hospitals must satisfy the same limit states as residential buildings, but at higher hazard IM values.
In the case of European building codes, some flexibility is included to allow each EU member state to define the minimum number of limit states to be explicitly checked but life-safety performance must always be checked. Non-compliance with the minimum performance checks stated within national hazard codes (or best international practice if a national code does not exist) results in a score of zero being assigned to B.3.2. Designers can choose to adopt more limit states than the minimum number defined in their national code. This results in a higher indicator score as multiple performance checks result in a more reliable and predictable structural performance, but not a more resilient structure. Higher scores for B.3.2 are also achieved when more advanced, state-of-the-art methodologies are used to design the structural components against the hazard, again providing greater reliability in the structural performance.
To this point, performance-based codes that set minimum (prescriptive) MRI for each performance objective included in the code, have been discussed. However, a designer, in consultation with a client and users, may also decide to set higher performance objectives for their project than those required by the code for the use, occupancy and importance of their project. Design to higher hazard levels will result in a reduction in structural and non-structural damage, facilitating faster recovery of functionality post-hazard event, and hence is given a higher indicator score. Higher scores are also achieved for projects that explicitly consider the safety of non-structural components and mechanical, electrical and plumbing (MEP) system performance. These measures reduce the loss of life during a hazard event and allow the rapid restoration of functionality after a hazard event.
The EU currently does not have a Europe-wide building code for flooding. National building design codes for flood resilience are typically prescriptive, with few allowing performance-based design. ASCE/SEI 7-22 Supplement 2, Table C5.3-4 (ASCE, 2023a) provides flood performance objectives for buildings with different occupancies and importance. It also provides guidance on how to design against foundation scour and flood debris impact. The difficulty of excluding water from the building envelope is recognised in most flood building codes, which allow for two design philosophies to be followed: (i) flood resistance in the case of small water depths and velocities, where water is kept out of the building by the building elements, and (ii) flood resilience, where some flood resistance is provided, but the water is allowed to enter the building. In the latter case, the design criteria aim to minimise the damage to building materials, services and contents. Guidance for the latter is provided by BS 85500 (BSI, 2015b) and Draft BS 85500 (BSI, 2024), which is used as a reference for the B.3.2 score development for these enhanced design features.
In the case of landslide hazards, it is highlighted that it is not typically cost effective nor are there accepted guidelines for designing to directly resist landslide hazards. The best means of achieving landslide resilience is to site the project on stable ground/slopes that are not susceptible to land sliding. However, with growing urbanisation and pressure on land, the built environment expands into areas with low to moderate landslide hazard. In these cases, according to AGS (2000), several actions can be taken to improve landslide resilience. These do not necessarily involve interventions on the structure, but instead involve intervening to stabilise the landslide, erect defensive barriers, as well as set up monitoring and warning systems. These elements therefore constitute the indicator metrics in the case of landslides.
Similar to the case of landslides, there are no building codes or widely accepted guidelines for the design against volcanic ash. However, it is recognised that projects may be sited in areas where volcanic ash may fall, as ash can be transported large distances from the volcano. Volcanic ash is very heavy when wet, corrosive, it can conduct electricity and be harmful to health. Most existing guidance on ashfall vulnerability focus on the collapse of buildings under the weight of ash, which has a density up to 2000 kg/m3 when wet (Blong et al., 2017). Some aspects of roof design can help reduce the accumulation of volcanic ash (USGS, 2024), whereas other resilience enhancing measures involve keeping ash out of interiors and protecting HVAC and sensitive equipment. The scoring criteria for resilience to volcanic ash are based on these features.
In the case of tsunami hazards, although no European building code exists, there are two international building codes in Japan and USA for the design of structures of critical importance, essential facilities or structures that act as vertical evacuation towers. The ASCE/SEI 7-22 chapter 6, Tsunami loads and effects (ASCE, 2022), is taken as reference for the development of B.3.2 indicator for tsunami. Additionally, insights from tsunami engineering research are included to provide enhanced design criteria for the evaluation.
Currently, the Eurocodes contain specific parts that deal with the fire resistance of structures. A performance-based approach is possible in the general framework of the Eurocodes, however, is not provided in detail. According to a recent review, Athanasopoulou et al. (2023) shows that fire safety and design regulations vary across EU member states, and that prescriptive methods of design for fire safety in buildings are largely prevalent in practice, even if a performance-based approach is allowed. ISO 23932-1 (ISO, 2018b) presents a performance-based framework for fire safety engineering. It provides significant flexibility to the designer to set the performance objectives (amongst which life-safety is mandatory), and guidance is provided on how this could be done in TR 16576 (ISO, 2017b), which draws on international practice. However, according to Athanasopoulou et al. (2023), the fire engineering community needs further standardisation of several equations and approaches for setting performance criteria. The UK Building Regulations Approved Document B – Fire safety (DLUHC, 2019) is a state-of-art document that provides practical guidance to meeting the technical requirements involved in achieving different performance criteria, for most common buildings and occupancy types. It does not provide information on the fire scenarios to be used, which are part of national regulations. This key reference is used as the basis for the indicator evaluation.
In terms of blast loading, EN 1991-1-7 (CEN, 2006) prescribes the need to design for an internal explosion in projects where gas is burned or regulated, or where explosive material such as explosive gases, or liquids forming explosive vapour or gas are stored or transported. The standard requires the structure to be designed to resist progressive collapse resulting from an internal explosion, in accordance with EN 1990, section 4.4 and annex E (CEN, 2023a). However, an overall approach for design under blast external loads is missing from the standard (Karlos and Solomos, 2013). When blast is from external sources/terrorist attack, the most effective means of protecting a structure is to deter the attack or keep the explosive as far away as possible by maximising the standoff distance. These can be achieved through heightened security and the placing of physical barriers, like bollards or large planters, between the road and the building (Cormie et al., 2020). Apart from avoiding progressive collapse, a number of design features can be implemented to help disperse the blast pressures, and the structure can be ‘hardened’ to absorb the energy of the attack and to protect valuable assets (Cormie et al., 2020). In the case of blast loading, performance criteria can be set for different blast scenarios (e.g. per ASCE, 2011), where a blast scenario has a defined type and weight of explosive, which is triggered in a specific location outside or within the project boundary. Multiple scenarios should be looked at with a variety of devices that befit the use and size of the building. These scenarios should be chosen as the most probable for the site; e.g. Karlos and Solomos (2013) – table 3 provide maximum charge weights per measure of transportation. The score of B.3.2 for blast is drawn from several sources of literature and international guidance.
Aspects of resilience can be achieved through the provision of redundancy. For example, ensuring that progressive collapse does not occur in the case that one structural element is severely damaged by wind- or water-borne debris, or that the safety of evacuation routes is not compromised if the active protection systems (like sprinklers) fail in case of fire. Aspects of redundancy that affect the design of structural and non-structural components are therefore included in B.3.2 evaluation.
Consideration of climate change effects will typically result in a higher IM value for the project design. Given that this level of IM might happen in the future, its consideration in design will result in a more reliable future performance, as well as an enhanced resilience in the short term. However, the inclusion of climate change effects on hazard characterisation is already part of B.3.1 score (hazard characterisation), and therefore not included in B.3.2.
Development of B.3.2 has been guided by a number of key building codes, standards, guidelines and indicator systems, namely: AGS (2000), ASCE (2020, 2022, 2023a, b), Building Resilience Index (International Finance Corporation, 2023), Cormie et al. (2020), Draft prEN 1998-1-1 (CEN, 2022), Draft prEN 1998-1-2 (CEN, 2023b), FEMA P-424 (FEMA, 2010), FEMA 426/BIPS-06 (FEMA, 2011a), ISO 23932-1 (ISO, 2018b), Karlos and Solomos (2013), REDi Extreme windstorms (ARUP, 2022), TR 16576 (ISO, 2017b), REDi Floods (ARUP, 2023), UK Building Regulations Approved Document B – Fire Safety (DLUHC, 2019).
Table 63. B.3.2 score for resilience to wind hazard.
| Metric | Score | Non-applicable1 |
| Select single value below: | ||
| Main wind resisting design does not comply with the national building code. | B.3.2i = 0, No further points to be added. | |
| Design of main wind resisting system complies with the national building code. | Check next metrics. | |
| In the project design (single selection allowed): | ||
| One performance objective is explicitly checked. | +20 | |
| Two performance objectives are explicitly checked. | +30 | |
| Three or more performance objectives are explicitly checked. | +40 | |
| In the project design (multiple selections allowed): | ||
| Enhanced performance objectives are used in the design (beyond code requirements). | +60 | |
| Design includes redundancy against loss of one load carrying element from windborne debris impact. | +10 | |
| 3D computational/FEM model is used for the design (single selection allowed): | ||
| Model includes the structural components only. | +5 | |
| Model includes structural and non-structural elements. | +10 | |
| Damage limitation is provided through the following design elements (multiple selections allowed): | ||
| Windows >1m2 in area are wind-rated. | +10 | ☐ |
| An enhanced envelope design is implemented to withstand damage at operational windspeeds, according to FEMA P-424 (FEMA, 2010), chapter 6.3.3 or similar national code. | +15 | |
| Chimneys and/or parapets are reinforced. | +10 | ☐ |
| Motion control (auxiliary damping devices) is implemented. | +15 | |
| Indicator score = Σ(metric scores) | ≤ 100 | |
1 If the non-applicable option is selected (when available), the full metric score is considered in the evaluation of the indicator score.
Source: JRC.
Table 64. B.3.2 score for resilience to flood hazard.
| Metric | Score | Non-applicable1 |
| Select single value below: | ||
| Flood resilience design does not comply with the national building code. | B.3.2i = 0, No further points to be added. | |
| Design of flood resistance (no water entry) and resilience (allowing water entry) system complies at a minimum with the national building code. | Check next metrics. | |
| In the project design (single selection allowed): | ||
| One performance objective is explicitly checked. | +20 | |
| Two or more performance objectives are explicitly checked. | +30 | |
| In the project design: | ||
| Enhanced performance objectives are used in the design (beyond national code requirements). | +40 | |
| The project also complies with or exceeds the following enhanced design features for structural stability based on ASCE/SEI 7-22 (ASCE, 2022) and BS 85500 (2015, 2024) (multiple selections allowed): | ||
| Structures shall be designed to resist flotation due to buoyancy forces as per ASCE/SEI 7-22 section 5.5.1. | +10 | |
| Structures shall be designed to resist sliding as per ASCE/SEI 7-22 section 5.5.2. | +10 | |
| The floor at ground level (including any lateral support provided at the perimeter) should have the necessary strength to resist uplift forces without excessive deformation or cracking. | +5 | |
| Vertical structural elements are designed to resist debris impact as per ASCE/SEI 7-22 section 5.3.9. | +5 | |
| Design includes redundancy against loss of one load carrying element from waterborne debris impact. | +5 | |
| Foundations are deeper than the scour level predicted using ASCE/SEI 7-22 section 5.3.8. | +10 | |
| The project also complies with or exceeds the following enhanced design features for reducing damage and recovery time based on ASCE/SEI 7-22 and BS 85500 (multiple selections allowed): | ||
| Habitable spaces, and uses particularly vulnerable to flood impacts, should be located above the predicted flood levels. | +5 | |
| A water-resistant external leaf, (e.g. concrete or rendered masonry), is used to limit water ingress. | +5 | |
| Areas likely to be at contact with flood water are built with materials that do not corrode and are water resistant or have low absorption. | +10 | |
| Flood resilient insulation is used under flooring and in cavity walls. | +5 | |
| Water resistance measures/devices are adopted to reduce water ingress through doors and windows, e.g. flood door. | +5 | |
| Damp proof membranes are used to minimise the passage of water through ground floors. | +5 | ☐ |
| Doors and windows are located above the predicted flood water levels. | +2.5 | |
| Boiler units and heat pumps are located above the predicted flood water levels. | +5 | ☐ |
| Openings for services are sealed with waterproof materials designed for this purpose. | +2.5 | |
| Electric sockets are located above the flood depth. | +2.5 | |
| Underfloor services containing electrical elements or ferrous materials are avoided. | +2.5 | |
| Non-return valves are used in the drainage system to prevent back-flow of diluted sewage | +2.5 | |
| Indicator score = Σ(metric scores) | ≤ 100 | |
1 If the non-applicable option is selected (when available), the full metric score is considered in the evaluation of the indicator score.
Source: JRC.
Table 65. B.3.2 score for resilience to earthquake hazard.
| Metric | Score | Non-applicable1 |
| Select single value below: | ||
| Main earthquake resistant design does not comply with the national building code. | B.3.2i = 0, No further points to be added. | |
| Design of for earthquake resistance complies with the national building code. | Check next metrics. | |
| In the project design (single selection allowed): | ||
| One performance objective is explicitly checked. | +20 | |
| Two performance objectives are explicitly checked. | +30 | |
| Three or more performance objectives are explicitly checked. | +40 | |
| In the project design: | ||
| Enhanced performance objectives are used in the design (beyond code requirements). | +60 | |
| 3D Computational/FEM model used for the design (single selection allowed): | ||
| Structural model meets the criteria in Draft prEN 1998-1-1, section 6.2 (CEN, 2022) and models only the structural elements. | +5 | |
| Structural model meets the criteria in Draft prEN 1998-1-1, section 6.2 and explicitly models both structural and non-structural elements. | +10 | |
| Analysis method (as defined in Draft prEN 1998-1-2, CEN, 2023b) used for the design (single selection allowed): | ||
| Force-based approach. | +0 | |
| Lateral forces method of analysis. | +0 | |
| Response spectrum analysis. | +5 | |
| Non-linear static analysis. | +10 | |
| Non-linear response history analysis with at least 7 earthquake time histories used as input. | +15 | |
| Damage limitation is provided through the following design elements (multiple selections allowed): | ||
| Enhanced damping devices, dissipative or re-centring devices are used in the design. | +15 | |
| Base-isolation is used in the design. | +15 | |
| Separation joints are provided in the design to isolate non-structural from structural elements. | +10 | |
| Main non-structural components are designed or reinforced to limit their damage. | +5 | |
| Critical mechanical components are appropriately anchored to prevent damage under ground shaking. | +5 | |
| Internal fittings and furniture that could fall causing injury, are appropriately anchored to the structure. | +5 | |
| Flexible gas piping is implemented. | +5 | ☐ |
| Indicator score = Σ(metric scores) | ≤ 100 | |
1 If the non-applicable option is selected (when available), the full metric score is considered in the evaluation of the indicator score.
Source: JRC.
Table 66. B.3.2 score for resilience to landslide hazard.
| Metric | Score |
| Select single value below: | |
| No interventions are carried out to stabilise the landslide, erect defensive barriers, nor set up monitoring and warning systems. | B.3.2i = 0, No further points to be added. |
| Landslide mitigation measures are carried out. | Check next metrics. |
| Landslide stabilisation is achieved through (multiple selections allowed): | |
| Planting of vegetation. | +20 |
| Reshaping the slope. | +40 |
| Installing stabilizing piles or anchors. | +20 |
| Enhanced drainage. | +30 |
| Damage/loss from landslides is mitigated using (multiple selections allowed): | |
| Rigid debris-resisting barriers. | +30 |
| Flexible barriers. | +20 |
| Monitoring and warning system for landslide. | +40 |
| Indicator score = Σ(metric scores) | ≤ 100 |
Source: JRC.
Table 67. B.3.2 score for resilience to volcanic ash hazard.
| Metric | Score | Non-applicable1 |
| Structural stability (multiple selections allowed): | ||
| The roof structural integrity is checked against local and global collapse from wet volcanic ash load (total ash fall thickness for mean recurrence interval (MRI) of at least 500 years should be assumed for conservatism). | +30 | |
| The capacity of the structural system is checked for stability under the weight of the wet ashfall on the roof. | +30 | |
| Damage/loss from volcanic ash is mitigated using (multiple selections allowed): | ||
| A pitched roof is used. | +10 | |
| Roof covering material is smooth (e.g. sheet metal) and can aid the shedding of ashfall. | +10 | |
| Hoods /covers are installed above HVAC air intake to reduce direct ash ingestion. | +10 | ☐ |
| Filters are applied to external air intakes. | +10 | ☐ |
| Air vents in walls and windows have a closing mechanism. | +10 | ☐ |
| Covers are available for sensitive equipment and computers | +5 | ☐ |
| Indicator score = Σ(metric scores) | ≤ 100 | |
1 If the non-applicable option is selected (when available), the full metric score is considered in the evaluation of the indicator score.
Source: JRC.
Table 68. B.3.2 score for resilience to tsunami hazard.
| Metric | Score | Non-applicable1 |
| Select single value below: | ||
| The project design does not comply with ASCE/SEI 7-22 chapter 6, Tsunami Loads and Effects (ASCE, 2022), and the project is an essential or critical facility (risk category III or IV in ASCE/SEI 7-22) or will act as a tsunami vertical evacuation structure. | B.3.2i = 0, No further points to be added. | |
| The project design does not comply with ASCE/SEI 7-22 chapter 6, Tsunami Loads and Effects, and the project is not an essential or critical facility (risk category III or IV in ASCE/SEI 7-22) and will not act as a tsunami vertical evacuation structure. | +0 | |
| The project design complies with ASCE/SEI 7-22 chapter 6, Tsunami Loads and Effects. | Check next metrics | |
| If [The project design complies with ASCE/SEI 7-22 chapter 6, Tsunami Loads and Effects] has been selected (single selection allowed): | ||
| One performance objective is explicitly checked (no global failure nor component failure for mean recurrence interval MRI=2500). | +40 | |
| Two or more performance objectives are explicitly checked. | +50 | |
| Modelling and analysis method used for the design (multiple selections allowed): | ||
| A 3D computational/FEM model is used for the design. | +10 | |
| Prescriptive assessment for global and component stability in ASCE/SEI 7-22 chapter 6. | +10 | |
| Non-linear static analysis appropriate for tsunami loading (e.g. variable depth pushover analysis, Baiguera et al., 2022) used for the global and component stability in ASCE/SEI 7-22 chapter 6. | +20 | |
| Analysis includes modelling the effects of non-structural failure progression. | +15 | |
| Damage limitation is provided through the following enhanced design criteria (multiple selections allowed): | ||
| Separation joints are provided in the design to isolate non-structural from structural elements. | +5 | |
| Non-structural components that pose a large area of resistance to the tsunami flow should be designed to break-away. | +10 | ☐ |
| Design includes redundancy against loss of one load carrying element from waterborne debris impact. | +10 | |
| Foundations are one third deeper than the scour depth predicted using ASCE/SEI 7-22 chapter 6 (see McGovern et al., 2018). | +10 | |
| All habitable areas and/or essential mechanical and electrical equipment are located outside the area of tsunami inundation or are elevated above the inundation level. | +20 | ☐ |
| Indicator score = Σ(metric scores) | ≤ 100 | |
1 If the non-applicable option is selected (when available), the full metric score is considered in the evaluation of the indicator score.
Source: JRC.
Table 69. B.3.2 score for resilience to fire hazard.
| Metric | Score | Non-applicable1 |
| Select single value below: | ||
| The design does not comply with the national fire safety code. | B.3.2i = 0, No further points to be added. | |
| A prescriptive design approach that is compliant with the national fire code is used. | +20 | |
| A performance-based design approach is adopted for the fire design, which at minimum meets the mandatory requirements of the national fire code. | +40 | |
| The project also complies with or exceeds the following enhanced design features regarding structural stability for fire (multiple selections allowed): | ||
| Load-bearing elements are designed for minimum fire resistance as per Appendix B (DLUHC, 2019). | +10 | |
| Elements with stability dependence, or which are common to more than one building or compartment meet the criteria of section 7.2a and 7.2b (DLUHC, 2019). | +10 | |
| The project also complies with or exceeds the following enhanced design features regarding inhibiting fire spread within the building: | ||
| Internal linings meet the requirements of Sections 6 (DLUHC, 2019). | +5 | |
| Fire compartment design meets the requirements of Section 8 (DLUHC, 2019) and (single selection allowed): | ||
| Limits fire spread to less than 25% of the floor area of a one storey building, or up to 100% of the floor area in one storey of a multi-storey building. | +5 | |
| Limits fire spread to the room/space of origin, which does not exceed 15% of the floor area of a storey in a building. | +15 | |
| Fire compartment design meets the requirements of Section 8 (DLUHC, 2019) and (multiple selections allowed): | ||
| A sprinkler system that meets criteria of Appendix E (DLUHC, 2019) is adopted for non-residential buildings >30m in height2. | +10 | ☐ |
| Evacuation routes are protected, as per Section 2.24 (DLUHC, 2019). | +10 | |
| Refuse chutes and storage are designed to Sections 5.42-5.46 (DLUHC, 2019). | +5 | ☐ |
| Design of cavities and concealed spaces according to Section 9 (DLUHC, 2019). | +5 | ☐ |
| Protection of openings (e.g. for utilities) in fire-separating elements, according to Sections 10.1-10.5 and 10.24-10.29 (DLUHC, 2019). | +5 | ☐ |
| Design to avoid fire spread through ducts and flues meets criteria in Sections 10.6-10.23 (DLUHC, 2019). | +5 | ☐ |
| Design to avoid fire spread along external walls according to Sections 12.3-12.16 (DLUHC, 2019)3. | +5 | |
| Design for venting of heat and smoke from basements meets the criteria of Section 18 (DLUHC, 2019). | +5 | ☐ |
| The project also complies with or exceeds the following enhanced design features regarding inhibiting fire spread to other buildings (multiple selections allowed): | ||
| Sufficient spacing is provided such that the amount of thermal radiation falling on a neighbouring existing building (or possible future building) from window openings and other unprotected areas in the building on fire is insufficient to start a fire (Section 13.4-13.23 in DLUHC, 2019). | +5 | ☐ |
| Walls common to two buildings are designed as compartment walls (Section 8 in DLUHC, 2019). | +5 | ☐ |
| Fire spread over roof is restricted (Section 14 in DLUHC, 2019). | +5 | |
| Highly hazardous products that may release polluting or toxic products during fires are placed in specifically designated areas which are fire-protected. | +5 | ☐ |
| All fixed appliances using controlled combustion and other fixed equipment are constructed and installed according to an appropriate fire safety standard. | +5 | |
| Indicator score = Σ(metric scores) | ≤ 100 | |
1 If the non-applicable option is selected (when available), the full metric score is considered in the evaluation of the indicator score.
2 The metric can only be considered non-applicable if the building being assessed is not a non-residential building >30m in height.
3 For this metric, external walls of a building include anything located within any space forming part of the wall, any decoration or other finish applied to any external (but not internal) surface forming part of the wall, any windows and doors in the wall (DLUHC, 2019).
Source: JRC.
Table 70. B.3.2 score for resilience to blast hazard.
| Metric | Score | Non-applicable1 |
| Select single value below: | ||
| The project has not been designed for blast loading. | B.3.2i = 0, No further points to be added. | |
| The project is designed for blast loading. | Check next metrics. | |
| Select multiple values below: | ||
| The project is designed to avoid progressive collapse from internal explosions2. | +20 | |
| The project is designed to avoid progressive collapse from external explosions2. | +20 | |
| The project design considers a more than two blast scenarios associated with the most likely explosive devices and blast locations external to the building. | +20 | |
| The design adopts a performance-based approach and explicitly considers (single selection allowed): | ||
| Two performance objectives. | +10 | |
| More than two performance objectives. | +20 | |
| For the calculation of blast loading (blast overpressure and duration) (single selection allowed): | ||
| Empirical equations are adopted. | +5 | |
| Phenomenological methods, are adopted. | +10 | |
| Computational fluid dynamics (CFD)-based analyses are adopted. | +20 | |
| Modelling and analysis method used for the design (single selection allowed): | ||
| Blast analysis is based on an equivalent static load approach. | +5 | |
| A dynamic blast response analysis for individual components based on a single-degree-of freedom (SDOF) model is used. | +5 | |
| A dynamic blast response analysis for individual components based on a 3D finite element model of the structure is used. | +10 | |
| Modelling and analysis method used for the design: | ||
| A safety factor of 20% is applied to the charge weights in the blast load calculation to account for uncertainty. | +10 | |
| Damage limitation is provided through the following enhanced design criteria from Cormie et al. (2020) (multiple selections allowed): | ||
| A minimum standoff distance of 15.0 m is provided for residential buildings and of 6.0m for non-residential ones. | +5 | |
| A known standoff distance is achieved through the placement of vehicle security barriers (i.e. traffic bollards, large planters or other physical barriers). | +10 | |
| The exterior building geometry has a convex form. | +5 | |
| The building does not have re-entrant corners, cantilevered upper floors nor set-backs. | +5 | |
| In the design, deep recesses that are accessible from ground level are avoided. | +5 | |
| The minimum amount of glazing compatible with other needs (thermal comfort, lighting etc) is provided. | +5 | |
| The building cladding spans vertically from floor to floor, with direct, robust connections into the structural slabs.3 | +5 | ☐ |
| Floor slabs are tied into the structural frame and designed to withstand load reversal. | +10 | |
| Internal protected spaces are provided (space of > 0.6 m2 per person). | +10 | |
| Critical facilities are located in the most well-defended parts of the building, such as basements. | +10 | ☐ |
| Glazing is made of laminated glass, or other blast resilient material. | +10 | ☐ |
| Indicator score = Σ(metric scores) | ≤ 100 | |
1 If the non-applicable option is selected (when available), the full metric score is considered in the evaluation of the indicator score.
2 Progressive collapse can be checked according to EN 1990, section 4.4 and annex E (CEN, 2023a), or equivalent standard.
3 The metric can be marked as non-applicable only where a building has load bearing walls with no cladding.
Source: JRC.
4.6.4 Consequence mitigation (B.3.3)
This consequence mitigation indicator (B.3.3) evaluates the extent to which the project design has measures in place to mitigate the consequences of extreme natural hazards on functionality and on the user community. The indicator focuses on design aspects that promote survivability (i.e. the availability of early warning) and on measures that can be taken to restore project functionality rapidly after a hazard event (e.g. availability of back-up systems). It is noted that dimensioning of spaces and signage for safe evacuation and emergency communication are considered in the indicator B.5.1 Ease of circulation (Section 4.8.2), and therefore not included here.
B.3.3 is evaluated independently of hazard type, as the integrated metrics are relevant to consequence mitigation from all natural and man-made hazards. Indicative performance classes for the B.3.3 scores are provided in Figure 62. While these thresholds and performance classes are not directly applied in the evaluation of KPI and dimension scores and performance classes, they are included here to assist users in determining appropriate performance levels for specific project aspects and to offer clear guidance on their improvement. The indicator evaluation is presented in Table 71 and the score B.3.3 cannot exceed 100. On some occasions, next to the metrics of the indicator, a “non-applicable” option exists, so that users can indicate that the specific metric is not relevant to the project attributes. If the non-applicable option is selected (when available), the full metric score should be considered in the evaluation of the indicator score, to avoid penalising a project due to non-relevant aspects.
Figure 62. B.3.3 indicative performance classes and thresholds.

Source: JRC.
Table 71. B.3.3 score.
| Metric | Score | Non-applicable1 |
| Hazard warning and response (multiple selections allowed): | ||
| Staff and users have access to a warning system for relevant hazards. | +5 | |
| An emergency response plan is in place that accounts for the characteristics of different hazards2. | +5 | |
| Training is provided to staff on what to do in an emergency and regular evacuation drills are conducted to test emergency operation procedures. | +5 | ☐ |
| Fire and emergency alarm systems are regularly checked. | +5 | |
| Automatic shut-down systems are in place for utilities or facilities to mitigate the risk of cascading hazards (e.g. fire following earthquakes). | +5 | ☐ |
| Emergency lighting is available along escape/evacuation routes. | +5 | |
| Each part of an evacuation route, such as exits, corridors and stairs have adequate width for evacuation, given the number of occupants (see Table 3.2 in DLUHC, 2019). | +5 | |
| Vehicle access is provided to the perimeter of the building for fire fighters and emergency services as per Section 15 of DLUHC (2019). | +5 | |
| Fire mains and hydrants are provided as per Section 16 of DLUHC (2019), or more stringent requirement. | +5 | |
| Fire-fighting shafts are provided by the design as per Section 17 of DLUHC (2019). | +5 | |
| Measures to promote rapid recovery (multiple selections allowed): | ||
| A business continuity plan3 is in place and communicated to staff in non-residential buildings. | +5 | ☐ |
| The project is insured for hazard-based losses. | +5 | |
| There are generators, fuel storage on-site to power essential systems for > 48 hrs. | +5 | |
| Potable water storage is sufficient to cover project needs for > 48 hrs. | +5 | |
| Backup natural gas supplies are available to cover project needs for > 48 hrs. | +5 | ☐ |
| Backup communication exists in the form of radio phones or satellite phones are available. | +5 | |
| Off-grid systems are in place to provide continuity of water and energy supply. | +5 | |
| A priority of service agreement is arranged with utility providers. | +5 | |
| Security systems are designed to remain active even with loss of power or have manual over-ride. | +5 | |
| Quick rebooting of server systems and a cloud migration plan to reduce dependence on on-site data storage. | +5 | ☐ |
| Indicator score = Σ(metric scores) | ≤ 100 | |
1 If the non-applicable option is selected (when available), the full metric score is considered in the evaluation of the indicator score.
2 The emergency plan should account for the arrival time of wind, tsunami and other hazard events, and account for the characteristics of each hazard.
3 Amongst other items, the business continuity plan should include plans for project cleanup and repair, prioritised restoration of different utilities and services in light of functional recovery.
Source: JRC.
4.6.5 Example (B.3)
The example case study is a newly built high school (non-residential main use) in southern Italy. The assessment is carried out at the building scale and no listed cultural heritage is affected by the project. The school building is a three-storey high reinforced concrete moment resisting frame. A sketch of the school and its ground floor plan are presented in Figure 63. Each floor contains four classrooms with a capacity of 30 children per class. A central staircase provides access to all floors and is located in the central bay of the school. Infill walls are made of unreinforced masonry, and large windows line the back and front of each classroom.
Figure 63. Sketch (left) and ground floor plan (right) of a fictitious high school in Southern Italy, used as an example for B.3 indicator evaluation.
|
|
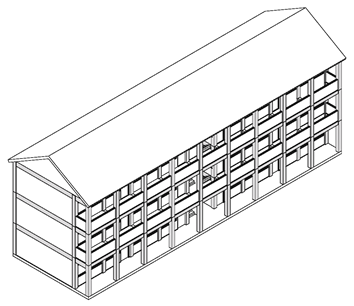
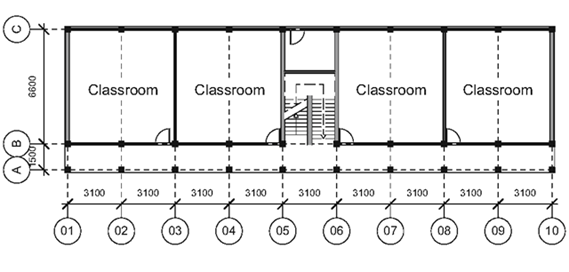
Source: JRC.
From hazard maps available from the National Institute of Geophysics and Volcanology in Italy (INGV), it is observed that the school is sited in an area prone to earthquakes and tsunami, but far enough inland from the coastline (1 km) and any waterways, thus, it is not prone to coastal or riverine flooding. It is also not prone to either landslides or volcanic ash. It is prone to wind, fire and blast hazards.
Table 72. Identification of hazards affecting the project.
| Hazard | Selection |
| Select man-made hazards of relevance to the project (multiple selections allowed): | |
| Wind | √ |
| Floods (riverine and coastal) | |
| Earthquakes | √ |
| Landslides | |
| Volcanic ash | |
| Tsunami | √ |
| Select man-made hazards of relevance to the project (multiple selections allowed): | |
| Fire | √ |
| Blast | √ |
| Total selections | 5 hazards |
Source: JRC.
The first part of the evaluation involves obtaining a score for the hazard characterisation indicator (B.3.1i) for wind, earthquake and tsunami.
The wind map from the Italian National Annex to Draft prEN 1991-1-4 (CEN, 2021f) is used for the wind design. The school is sited in wind zone 3, which is associated with a fundamental value of the basic wind speed of 27 m/s. According to the code, the basic wind speed corresponds to the characteristic 10-minute mean wind velocity at a height of 10 m above ground level, with an annual probability of being exceeded of 0.02 (MRI = 50 years). This is used to calculate a basic wind velocity of 28 m/s and 30.3 m/s for MRIs of 100 and 500 years, respectively, using equation 6.1 in the Draft prEN 1991-1-4 (using the shape parameter depending on the coefficient of variation of the extreme-value distribution k = 0.2, and the exponent n = 0.5). The code is applied for the wind design of the school building, with wind actions on structures and structural elements determined considering both external and internal wind pressures. No wind tunnel test is carried out for the structure, as it is low-rise and is sited in a semi-rural area.
In the case of earthquake hazard, the latest approved Italian earthquake hazard map is accessed via a GIS platform on INGV website. The map shows the probabilistic seismic hazard and has been derived using more than one ground motion prediction equation. The map provides peak ground acceleration (PGA) values for eight MRI values for any location on the Italian territory. The values of PGA for the school location are plotted against MRI to develop a hazard curve. The earthquake engineering design of the school employs performance checks according to Draft prEN 1998-1-2, table 4.3 (CEN, 2023b) performance criteria, which state that for a school (building class CC3-a) the following performance objectives should be considered: Damage Limitation limit state for MRI = 125 years; Significant Damage limit state for MRI = 700; Near Collapse limit state for MRI = 2500. The hazard curve is used to estimate the PGA values for these MRIs; PGAs are found equal to 0.18g, 0.25g and 0.33g for the three MRI values in increasing order. A 3D finite element model of the school is built, and non-linear static analysis is adopted to analyse, design and check the structure performance under the three earthquake intensity levels.
For the tsunami hazard, a recent study (Basili et al, 2018) conducted as part of a large European Union funded project called TSUMAPS-NEAM, produced a probabilistic tsunami hazard map for the North-eastern Atlantic, Mediterranean and Connected Seas ([1]). This map provides the maximum inundation height at the coastline nearest the school to be 1.78 m for MRI = 2500 years. The NASA Sea level projection tool ([2]) () is used to source a sea level rise projection of 0.31 m for the SSP2-4.5 scenario at mid century. This is added to the coastal inundation height to become 2.09 m. As only one projection is used, the enhanced criteria score for use of the three projections of climate change is not met. A transect of the topography between the coastline and the school location is found and the Energy Gradeline Analysis of ASCE/SEI 7-22 chapter 6 (ASCE, 2022), is carried out. This results in a tsunami inundation depth prediction of 1.67 m at the site of the school. The waterborne debris impact is designed as per ASCE/SEI 7-22.
The values of B.3.1 for blast and fire are considered equal to the relevant for B.3.2 values for the respective hazards.
The scores for the hazard characterisation indicator (B.3.1) for wind, earthquake and tsunami hazards are provided in Table 73, Table 74 and Table 75, respectively.
Table 73. Example of B.3.1 evaluation for wind hazard.
| Metric | Score | Non-applicable1 |
| Select single value below: | ||
| A probabilistic hazard map from the national code of practice or from a reputable existing scientific study, is used for the intensity measure (IM) determination. | +20 | |
| A site-specific probabilistic hazard assessment is conducted (as per REDI Extreme windstorms ARUP, 2022, or equivalent) | Check next metrics. | |
| If [site-specific probabilistic hazard assessment] has been selected, select single value below: | ||
| The topographical, bathymetric or urban arrangement features that are likely to increase the hazard intensity at a site are considered. | 0 | |
| The topographical, bathymetric or urban arrangement features that are likely to increase the hazard intensity at a site are not considered. | 0 | |
| If [site-specific probabilistic hazard assessment] has been selected: | ||
| Wind-tunnel tests are conducted to verify the calculated effect of surrounding urban environment/topography on the IM. | 0 | |
| If climate change effects are considered, the IM values for different mean recurrence intervals (MRIs) are calculated through (multiple selections allowed): | ||
| Consideration of three climate scenarios (IPCC, 2022): (i) business-as-usual (RCP 8.5), (ii) the transition scenario (RCP 4.5), (iii) the ambitious scenario (RCP2.6). | 0 | |
| Downscaling through use of high-resolution climate models – site specific climate assessment. | 0 | |
| Use of mid-century climate projections (as defined in IPCC, 2022). | 0 | |
| Use of late-century climate projections (as defined in IPCC, 2022). | 0 | |
| The following co-incident hazards are accounted for in the load case scenarios used for design (multiple selections allowed): | ||
| Wind + snow accumulation + ice accretion. | +10 | ☐ |
| Wind + windborne debris2. | +10 | |
| Indicator score = Σ(metric scores) | 40 | |
1 If the non-applicable option is selected (when available), the full metric score is considered in the evaluation of the indicator score.
2 For windborne debris, simplified methods in codes of practice can be used to assess possible impacts.
Source: JRC.
Table 74. Example of B.3.1 evaluation for earthquake hazard.
| Metric | Score |
| Select single value below: | |
| A probabilistic hazard map from the national code of practice or from a reputable existing scientific study, is used for the IM determination. | +20 |
| A site-specific probabilistic seismic hazard assessment (PSHA) is conducted: | Check next metrics. |
| If [site-specific probabilistic seismic hazard assessment] has been selected, check the metrics below (multiple selections allowed): | |
| The hazard assessment is carried out using past observation data coupled with ground motion prediction equations (GMPE). | 0 |
| More than one GMPE is used. | 0 |
| Spatial correlation is accounted for (see Baker and Chen, 2020). | 0 |
| Physics-based earthquake ground-motion simulations (see Taborda and Roten, 2015) are used in the hazard calculation. | 0 |
| The topographical and geological features that are likely to increase the hazard intensity at a site are accounted for in the hazard calculation. | 0 |
| Response spectra and earthquake records used for the design (single selection allowed): | |
| Standard spectral shapes (uniform hazard spectra) associated with national codes of practice are used in the design and/or as targets for the selection of ground motions. | +10 |
| Conditional mean spectra (e.g. Baker, 2011) are defined from PSHA and are used for design or as targets for the selection of ground motions. | 0 |
| A selection of records is used from physics-based probabilistic seismic hazard assessment (see Bradley et al., 2015 for example). | 0 |
| The following co-incident hazards are accounted for in the load case scenarios used for design: | |
| An assessment of the liquefaction potential of soils at the project site is conducted. | +15 |
| Indicator score = Σ(metric scores) | 45 |
Source: JRC.
Table 75. Example of B.3.1 evaluation for tsunami hazard.
| Metric | Score |
| Select single value below: | |
| Multiple deterministic tsunami inundation footprints obtained from reputable scientific studies and/or past tsunami events are adopted for the intensity measure (IM) determination. | 0 |
| A probabilistic hazard map from the national code of practice or from a reputable existing scientific study, is used to determine the tsunami height at the coastline. | +20 |
| A bespoke probabilistic tsunami hazard assessment is conducted using numerical simulations (e.g. Salah et al., 2021) to determine the tsunami height at the coastline. | 0 |
| Inundation characteristics at the project site (i.e. runup, inundation depth, inundation velocity) are calculated from the tsunami height at the coastline using (single selection allowed): | |
| Empirical runup equations (e.g. McGovern et al. 2018), interpolated inundation depths, and inundation velocities evaluated from ASCE/SEI 7-22 chapter 6 (ASCE, 2022). | 0 |
| The Energy Gradeline Analysis (for inundation depth and runup estimation)1 and inundation velocity equations from ASCE/SEI 7-22 chapter 6. | +20 |
| Numerical inundation simulations1. | 0 |
| Climate change effects on sea level rise are considered, and the IM values for different mean recurrence intervals (MRIs) are calculated through (multiple selections allowed): | |
| Consideration of three climate scenarios (IPCC, 2022): (i) business-as-usual (RCP 8.5), (ii) the transition scenario (RCP 4.5), (iii) the ambitious scenario (RCP2.6). | 0 |
| Downscaling through use of high-resolution climate models - site specific climate assessment. | 0 |
| Use of mid-century climate projections. | +5 |
| Use the late-century climate projections. | 0 |
| The following co-incident hazards are accounted for in the load case scenarios used for design: | |
| Tsunami inundation + waterborne debris (as per the simplified approach in ASCE/SEI 7-22). | +15 |
| Indicator score = Σ(metric scores) | 60 |
1 Both the Energy Gradeline Analysis in ASCE/SEI 7-22 chapter 6, and numerical inundation models can take into account any amplifying effects of inundation from topography.
Source: JRC.
Subsequently, the scores of the hazard resilient design indicator (B.3.2i) are evaluated for wind, earthquake, tsunami, fire and blast.
In the case of wind, the Eurocodes are followed using Nationally Determined Parameters for Italy. Wind design is carried out for the ultimate and serviceability limit states. The same finite element model created for the school building to conduct the seismic design, is adopted to check the wind design. In the model, the infill panels are modelled for in-plane resistance through an equivalent strut approach. Enhanced performance criteria are not used beyond the prescriptions of the code for school structures. The design is checked with respect to EN 1990, section 4.4 and annex E (CEN, 2023a) for progressive collapse, if one column is damaged, and is found to be sufficiently robust (redundant). The windows in the school are large, and are wind rated. There is no chimney in the school, and the parapet walls along the external walkways at the ground and first floor are not reinforced.
For the earthquake resilient design, as stated above, three performance objectives are checked explicitly, and a non-linear static procedure is adopted for the structural analysis. The developed finite element model meets the guidelines of Draft prEN 1998-1-1, section 6.2 (CEN, 2022) and includes the infill walls in the modelling. Enhanced performance criteria are not used beyond the prescriptions of the code for school structures. No damping devices or base-isolation is adopted in the design due to economic constraints. Separation joints are not provided between the infill walls and the surrounding structural elements. The infills and other main non-structural components are not designed or reinforced to limit their damage. HVAC ducting in ceilings is restrained so as not to cause damage to ceiling tiles in the case of ground shaking. Bookcases and heavy furniture are fixed to walls or floors to avoid their toppling in an earthquake event. Flexible gas piping is implemented across the school.
The school governing board wants the school to act as a vertical evacuation tower, to facilitate the evacuation of the school children in the case of tsunami. Hence, the school design is conducted in adherence with ASCE/SEI 7-22 (ASCE, 2022) requirements. Only the collapse limit state is checked for the 2500-year tsunami inundation depth of 1.67 m (see above). The same 3D finite element model is adopted to conduct a variable depth pushover analysis. Out-of-plane failure of the infill walls is calculated from yield line theory, and the effect of their breaking is simulated in the pushover loading histories (see Del Zoppo et al. 2021). The global capacity of the school under tsunami loading exceeds the demand load calculated from the inundation height calculated per ASCE/SEI 7-22, chapter 6, Load Case 2. Hence, the structure satisfies the global checks. However, the component checks show that the shear capacity of the columns needs to be enhanced. Additional shear reinforcement is added throughout the ground floor columns such that the component check is also satisfied. No separation is provided between the infill panels and surrounding frame, and the infills are not specifically designed to breakaway. However, in the analysis, it is observed that they do collapse out-of-plane during the tsunami inundation, as the panels consist of weak material, resulting in a reduction of load on the structural elements. The school does not have living areas. All important equipment that might be damaged when wet is located above the second floor of the building. This includes the boiler.
The school is designed for fire in accordance with the current fire code in Italy (Ministry of the Interior, 2023). This code sets out performance objectives in relation to the importance and function of the building. The school falls in Category IV of the code, and should provide fire resistance such that limited damage to the structure is evident after the fire event. The fire is characterised by a standard fire curve (Section S.2.7 of the code), and to achieve the Damage Limitation limit state, deflections of loaded structural elements must be limited to 1/100 of the member length during the fire. Compartmentalisation is required such that there is no fire spread beyond the originating classroom, and doors and windows must not allow smoke transmission. However, each classroom has a floor area that is 18.1% (i.e. >15%) of the total floor area of one storey. Fire load is calculated per Section S.2.9 of the code from knowledge of the compartment size and combustibles contained. For the fire resistance, the European Standards are used, e.g. EN 13501-2 (CEN, 2023c). The EN standard is prescriptive and results in fire resistance of elements and doors that exceed the requirements of Table B4 in UK Building Regulations Approved Document B (DLUHC, 2019). The lining material requirements of UK Approved Document Bare satisfied. No sprinkler system is installed. The evacuation route is the central staircase of the building, which is only partially surrounded by reinforced concrete walls and does not provide the level of evacuation route protection specified in the UK Approved Document B (DLUHC, 2019). The only cavity is the roof space, and that qualifies as an extensive cavity, according to Section 9 of UK Approved Document B (DLUHC, 2019) as it has a dimension that exceeds 20 m. To achieve fire safety, the cavity needs to be divided up with cavity barriers, but such a measure has not been applied. Openings made by utilities in fire-separating elements are protected, but the ducts are not. The external walls are made of masonry infill, therefore, they exceed the requirement that external wall material should have a density of 300 kg/m3 or more, which, when tested to BS 476-11 (BSI, 1982), does not flame, and causes a rise in temperature on the furnace thermocouple not exceeding 20°C. The school does not have a basement. The school is in a semi-rural area and at significant distance from any neighbouring building. Moreover, the boundaries of the school walls ensure no future construction is within 30 m of the school building. Thus, fire in the building cannot spread fire to adjacent buildings. All appliances have certification and are installed by qualified professionals. No hazardous substances are kept on the premises due to the presence of children.
In the blast loading design, internal explosions have not been accounted for as there is no kitchen area in the school and no stored gas. The school has a security and safeguarding system in place which makes it extremely difficult for students to bring in any weapon or for someone external to enter the school perimeter. There is a perimeter fence that surrounds the building at a 20m distance from the school footprint. Only scenarios of terrorist attack are considered applicable, with a minimum standoff distance of 20 m. Several scenarios of blast are considered. The worst case is a 100 kg TNT detonation at ground level. An empirical method is used for the design against blast loading. This assumes that the blast detonates at a distance of 20 m, and will apply a uniform pressure across the front of the building. Design charts like those of Unified Facilities Criteria (US Army Corps of Engineers et al., 2008) can be used to calculate the parameters of the blast pressure time history on each façade of the building and at roof level. More details of the calculation approach are available in Karlos and Solomos (2013). In the indicator evaluation, robustness against progressive collapse from damage to an external member is scored (see earlier). The design against blast only considers the collapse performance, and hence is not following a performance-based design. A safety factor of 20% is not applied to the charge weight, and a single degree of freedom approach is considered to check component resistance to the blast load. Accordingly, the design ensures that under the considered blast loading the structure will not collapse. Enhanced design criteria regarding the shape of the building are not met. Significant glazing above minimum needs is provided to maximise light in the classrooms. The floor slab is connected to the frame fully and can sustain reverse loading. The cladding (infill) spans the height of the floor and is also connected to the slabs above and below. Glazing is not made of laminated glass.
The scores for the hazard resilient design indicator (B.3.2) for wind, earthquake, tsunami, fire and blast hazards are provided in Table 76–Table 80.
Table 76. Example of B.3.2 evaluation for resilience to wind hazard.
| Metric | Score | Non-applicable1 |
| Select single value below: | ||
| Main wind resisting design does not comply with the national building code. | x | |
| Design of main wind resisting system complies with the national building code. | √ Check next metrics. | |
| In the project design (single selection allowed): | ||
| One performance objective is explicitly checked. | 0 | |
| Two performance objectives are explicitly checked. | +30 | |
| Three or more performance objectives are explicitly checked. | 0 | |
| In the project design (multiple selections allowed): | ||
| Enhanced performance objectives are used in the design (beyond code requirements). | 0 | |
| Design includes redundancy against loss of one load carrying element from windborne debris impact. | +10 | |
| 3D computational/FEM model is used for the design (single selection allowed): | ||
| Model includes the structural components only. | 0 | |
| Model includes structural and non-structural elements. | +10 | |
| Damage limitation is provided through the following design elements (multiple selections allowed): | ||
| Windows >1m2 in area are wind-rated. | +10 | ☐ |
| An enhanced envelope design is implemented to withstand damage at operational windspeeds, according to FEMA P-424 (FEMA, 2010), chapter 6.3.3 or similar national code. | 0 | |
| Chimneys and/or parapets are reinforced. | 0 | ☐ |
| Motion control (auxiliary damping devices) is implemented. | 0 | |
| Indicator score = Σ(metric scores) | 60 | |
1 If the non-applicable option is selected (when available), the full metric score is considered in the evaluation of the indicator score.
Source: JRC.
Table 77. Example of B.3.2 evaluation for resilience to earthquake hazard.
| Metric | Score | Non-applicable1 |
| Select single value below: | ||
| Main earthquake resistant design does not comply with the national building code. | x | |
| Design of for earthquake resistance complies with the national building code. | √ Check next metrics. | |
| In the project design (single selection allowed): | ||
| One performance objective is explicitly checked. | 0 | |
| Two performance objectives are explicitly checked. | 0 | |
| Three or more performance objectives are explicitly checked. | +40 | |
| In the project design: | ||
| Enhanced performance objectives are used in the design (beyond code requirements). | 0 | |
| 3D Computational/FEM model used for the design (single selection allowed): | ||
| Structural model meets the criteria in Draft prEN 1998-1-1, section 6.2 (CEN, 2022) and models only the structural elements. | 0 | |
| Structural model meets the criteria in Draft prEN 1998-1-1, section 6.2 and explicitly models both structural and non-structural elements. | +10 | |
| Analysis method (as defined in Draft prEN 1998-1-2, CEN, 2023b) used for the design (single selection allowed): | ||
| Force-based approach. | 0 | |
| Lateral forces method of analysis. | 0 | |
| Response spectrum analysis. | 0 | |
| Non-linear static analysis. | +10 | |
| Non-linear response history analysis with at least 7 earthquake time histories used as input. | 0 | |
| Damage limitation is provided through the following design elements (multiple selections allowed): | ||
| Enhanced damping devices, dissipative or re-centring devices are used in the design. | 0 | |
| Base-isolation is used in the design. | 0 | |
| Separation joints are provided in the design to isolate non-structural from structural elements. | 0 | |
| Main non-structural components are designed or reinforced to limit their damage. | 0 | |
| Critical mechanical components are appropriately anchored to prevent damage under ground shaking. | +5 | |
| Internal fittings and furniture that could fall causing injury, are appropriately anchored to the structure. | +5 | |
| Flexible gas piping is implemented. | +5 | ☐ |
| Indicator score = Σ(metric scores) | 75 | |
1 If the non-applicable option is selected (when available), the full metric score is considered in the evaluation of the indicator score.
Source: JRC.
Table 78. Example of B.3.2 evaluation for resilience to tsunami hazard.
| Metric | Score | Non-applicable1 |
| Select single value below: | ||
| The project design does not comply with ASCE/SEI 7-22 chapter 6, Tsunami Loads and Effects (ASCE, 2022), and the project is an essential or critical facility (risk category III or IV in ASCE/SEI 7-22) or will act as a tsunami vertical evacuation structure. | x | |
| The project design does not comply with ASCE/SEI 7-22 chapter 6, Tsunami Loads and Effects, and the project is not an essential or critical facility (risk category III or IV in ASCE/SEI 7-22) and will not act as a tsunami vertical evacuation structure. | 0 | |
| The project design complies with ASCE/SEI 7-22 chapter 6, Tsunami Loads and Effects. | √ Check next metrics | |
| If [The project design complies with ASCE/SEI 7-22 chapter 6, Tsunami Loads and Effects] has been selected (single selection allowed): | ||
| One performance objective is explicitly checked (no global failure nor component failure for mean recurrence interval MRI=2500). | +40 | |
| Two or more performance objectives are explicitly checked. | 0 | |
| Modelling and analysis method used for the design (multiple selections allowed): | ||
| A 3D computational/FEM model is used for the design. | +10 | |
| Prescriptive assessment for global and component stability in ASCE/SEI 7-22 chapter 6. | 0 | |
| Non-linear static analysis appropriate for tsunami loading (e.g. variable depth pushover analysis, Baiguera et al., 2022) used for the global and component stability in ASCE/SEI 7-22 chapter 6. | +20 | |
| Analysis includes modelling the effects of non-structural failure progression. | +15 | |
| Damage limitation is provided through the following enhanced design criteria (multiple selections allowed): | ||
| Separation joints are provided in the design to isolate non-structural from structural elements. | 0 | |
| Non-structural components that pose a large area of resistance to the tsunami flow should be designed to break-away. | 0 | ☐ |
| Design includes redundancy against loss of one load carrying element from waterborne debris impact. | +10 | |
| Foundations are one third deeper than the scour depth predicted using ASCE/SEI 7-22 chapter 6 (see McGovern et al., 2018). | 0 | |
| All habitable areas and/or essential mechanical and electrical equipment are located outside the area of tsunami inundation or are elevated above the inundation level. | +20 | ☐ |
| Indicator score = Σ(metric scores) | 100 | |
1 If the non-applicable option is selected (when available), the full metric score is considered in the evaluation of the indicator score.
Source: JRC.
Table 79. Example of B.3.2 evaluation for resilience to fire hazard.
| Metric | Score | Non-applicable1 |
| Select single value below: | ||
| The design does not comply with the national fire safety code. | x | |
| A prescriptive design approach that is compliant with the national fire code is used. | +20 | |
| A performance-based design approach is adopted for the fire design, which at minimum meets the mandatory requirements of the national fire code. | 0 | |
| The project also complies with or exceeds the following enhanced design features regarding structural stability for fire (multiple selections allowed): | ||
| Load-bearing elements are designed for minimum fire resistance as per Appendix B (DLUHC, 2019). | +10 | |
| Elements with stability dependence, or which are common to more than one building or compartment meet the criteria of section 7.2a and 7.2b (DLUHC, 2019). | +10 | |
| The project also complies with or exceeds the following enhanced design features regarding inhibiting fire spread within the building: | ||
| Internal linings meet the requirements of Sections 6 (DLUHC, 2019). | +5 | |
| Fire compartment design meets the requirements of Section 8 (DLUHC, 2019) and (single selection allowed): | ||
| Limits fire spread to less than 25% of the floor area of a one storey building, or up to 100% of the floor area in one storey of a multi-storey building. | +5 | |
| Limits fire spread to the room/space of origin, which does not exceed 15% of the floor area of a storey in a building. | 0 | |
| Fire compartment design meets the requirements of Section 8 (DLUHC, 2019) and (multiple selections allowed): | ||
| A sprinkler system that meets criteria of Appendix E (DLUHC, 2019) is adopted for non-residential buildings >30m in height2. | 10 | ☒ |
| Evacuation routes are protected, as per Section 2.24 (DLUHC, 2019). | 0 | |
| Refuse chutes and storage are designed to Sections 5.42-5.46 (DLUHC, 2019). | 0 | ☐ |
| Design of cavities and concealed spaces according to Section 9 (DLUHC, 2019). | 0 | ☐ |
| Protection of openings (e.g. for utilities) in fire-separating elements, according to Sections 10.1-10.5 and 10.24-10.29 (DLUHC, 2019). | +5 | ☐ |
| Design to avoid fire spread through ducts and flues meets criteria in Sections 10.6-10.23 (DLUHC, 2019). | 0 | ☐ |
| Design to avoid fire spread along external walls according to Sections 12.3-12.16 (DLUHC, 2019)3. | +5 | |
| Design for venting of heat and smoke from basements meets the criteria of Section 18 (DLUHC, 2019). | +5 | ☒ |
| The project also complies with or exceeds the following enhanced design features regarding inhibiting fire spread to other buildings (multiple selections allowed): | ||
| Sufficient spacing is provided such that the amount of thermal radiation falling on a neighbouring existing building (or possible future building) from window openings and other unprotected areas in the building on fire is insufficient to start a fire (Section 13.4-13.23 in DLUHC, 2019). | +5 | ☐ |
| Walls common to two buildings are designed as compartment walls (Section 8 in DLUHC, 2019). | +5 | ☒ |
| Fire spread over roof is restricted (Section 14 in DLUHC, 2019). | 0 | |
| Highly hazardous products that may release polluting or toxic products during fires are placed in specifically designated areas which are fire-protected. | +5 | ☒ |
| All fixed appliances using controlled combustion and other fixed equipment are constructed and installed according to an appropriate fire safety standard. | +5 | |
| Indicator score = Σ(metric scores) | 95 | |
1 If the non-applicable option is selected (when available), the full metric score is considered in the evaluation of the indicator score.
2 The metric can only be considered non-applicable if the building being assessed is not a non-residential building >30m in height.
3 For this metric, external walls of a building include anything located within any space forming part of the wall, any decoration or other finish applied to any external (but not internal) surface forming part of the wall, any windows and doors in the wall (DLUHC, 2019).
Source: JRC.
Table 80. Example of B.3.2 evaluation for resilience to blast hazard.
| Metric | Score | Non-applicable1 |
| Select single value below: | ||
| The project has not been designed for blast loading. | x | |
| The project is designed for blast loading. | √ Check next metrics. | |
| Select multiple values below: | ||
| The project is designed to avoid progressive collapse from internal explosions2. | 0 | |
| The project is designed to avoid progressive collapse from external explosions2. | +20 | |
| The project design considers a more than two blast scenarios associated with the most likely explosive devices and blast locations external to the building. | +20 | |
| The design adopts a performance-based approach and explicitly considers (single selection allowed): | ||
| Two performance objectives. | 0 | |
| More than two performance objectives. | 0 | |
| For the calculation of blast loading (blast overpressure and duration) (single selection allowed): | ||
| Empirical equations are adopted. | +5 | |
| Phenomenological methods, are adopted. | 0 | |
| Computational fluid dynamics (CFD)-based analyses are adopted. | 0 | |
| Modelling and analysis method used for the design (single selection allowed): | ||
| Blast analysis is based on an equivalent static load approach. | 0 | |
| A dynamic blast response analysis for individual components based on a single-degree-of freedom (SDOF) model is used. | +5 | |
| A dynamic blast response analysis for individual components based on a 3D finite element model of the structure is used. | 0 | |
| Modelling and analysis method used for the design: | ||
| A safety factor of 20% is applied to the charge weights in the blast load calculation to account for uncertainty. | 0 | |
| Damage limitation is provided through the following enhanced design criteria from Cormie et al. (2020) (multiple selections allowed): | ||
| A minimum standoff distance of 15.0 m is provided for residential buildings and of 6.0m for non-residential ones. | +5 | |
| A known standoff distance is achieved through the placement of vehicle security barriers (i.e. traffic bollards, large planters or other physical barriers). | +10 | |
| The exterior building geometry has a convex form. | 0 | |
| The building does not have re-entrant corners, cantilevered upper floors nor set-backs. | 0 | |
| In the design, deep recesses that are accessible from ground level are avoided. | +5 | |
| The minimum amount of glazing compatible with other needs (thermal comfort, lighting etc) is provided. | 0 | |
| The building cladding spans vertically from floor to floor, with direct, robust connections into the structural slabs.3 | +5 | ☐ |
| Floor slabs are tied into the structural frame and designed to withstand load reversal. | +10 | |
| Internal protected spaces are provided (space of > 0.6 m2 per person). | 0 | |
| Critical facilities are located in the most well-defended parts of the building, such as basements. | +10 | ☒ |
| Glazing is made of laminated glass, or other blast resilient material. | 0 | ☐ |
| Indicator score = Σ(metric scores) | 95 | |
1 If the non-applicable option is selected (when available), the full metric score is considered in the evaluation of the indicator score.
2 Progressive collapse can be checked according to EN 1990, section 4.4 and annex E (CEN, 2023a), or equivalent standard.
3 The metric can be marked as non-applicable only where a building has load bearing walls with no cladding.
Source: JRC.
Finally, the consequence mitigation indicator (B.3.3) is evaluated. In terms of hazard warnings, the school is within earshot of tsunami warning towers and is also equipped with fire alarms. The location is not susceptible to landslides and so there is no need for a warning. Through the Italian Civil Protection and police, respectively, the school receives warnings of severe weather conditions and any terrorist threats. An emergency response plan for terrorist or gunman attack is present in the school, and teachers are trained on what to do in such events. Fire alarm and evacuation drills take place once a month, and tsunami evacuation practice to upper floors in the schools is practiced once a year. Automatic shutdown systems are not in place for utilities. Emergency lighting for evacuation routes is not provided. There are four classrooms with 30 children each at each storey. There are also two teachers on average per storey. Hence, from Table 3.3 of UK Approved Document B (DLUHC, 2019), the stair width for phased evacuation should be a minimum of 1.20 m wide. Considering the plan in Figure 63, this requirement is met. Sufficient fire hydrants and access is provided by the design to fire fighters. No fire shaft is however present. The school has an arrangement with a nearby school that in case of shut down, the other school will host the children such that education continuity can be ensured. The school is not insured against natural hazards. The school has a back-up generator and water tank on site that can provide 48 hours of independence from the grid. However, it does not have gas storage on site, access to off grid services or a pre-arranged priority of service agreement with local utility companies. The teachers have access to a satellite phone, which is provided to the school as a precaution by the local council. Finally, the security system can function if there is loss of energy, but no fast reboot system is put in place for the school computing systems. The evaluation of B.3.3 is shown in Table 81.
Table 81. Example of B.3.3 evaluation.
| Metric | Score | Non-applicable1 |
| Hazard warning and response (multiple selections allowed): | ||
| Staff and users have access to a warning system for relevant hazards. | +5 | |
| An emergency response plan is in place that accounts for the characteristics of different hazards2. | +5 | |
| Training is provided to staff on what to do in an emergency and regular evacuation drills are conducted to test emergency operation procedures. | +5 | ☐ |
| Fire and emergency alarm systems are regularly checked. | +5 | |
| Automatic shut-down systems are in place for utilities or facilities to mitigate the risk of cascading hazards (e.g. fire following earthquakes). | 0 | ☐ |
| Emergency lighting is available along escape/evacuation routes. | 0 | |
| Each part of an evacuation route, such as exits, corridors and stairs have adequate width for evacuation, given the number of occupants (see Table 3.2 in DLUHC, 2019). | +5 | |
| Vehicle access is provided to the perimeter of the building for fire fighters and emergency services as per Section 15 of DLUHC (2019). | +5 | |
| Fire mains and hydrants are provided as per Section 16 of DLUHC (2019), or more stringent requirement. | +5 | |
| Fire-fighting shafts are provided by the design as per Section 17 of DLUHC (2019). | 0 | |
| Measures to promote rapid recovery (multiple selections allowed): | ||
| A business continuity plan3 is in place and communicated to staff in non-residential buildings. | +5 | ☐ |
| The project is insured for hazard-based losses. | 0 | |
| There are generators, fuel storage on-site to power essential systems for > 48 hrs. | +5 | |
| Potable water storage is sufficient to cover project needs for > 48 hrs. | +5 | |
| Backup natural gas supplies are available to cover project needs for > 48 hrs. | +5 | ☒ |
| Backup communication exists in the form of radio phones or satellite phones are available. | +5 | |
| Off-grid systems are in place to provide continuity of water and energy supply. | 0 | |
| A priority of service agreement is arranged with utility providers. | 0 | |
| Security systems are designed to remain active even with loss of power or have manual over-ride. | +5 | |
| Quick rebooting of server systems and a cloud migration plan to reduce dependence on on-site data storage. | 0 | ☐ |
| Indicator score = Σ(metric scores) | 65 | |
1 If the non-applicable option is selected (when available), the full metric score is considered in the evaluation of the indicator score.
2 The emergency plan should account for the arrival time of wind, tsunami and other hazard events, and account for the characteristics of each hazard.
3 Amongst other items, the business continuity plan should include plans for project cleanup and repair, prioritised restoration of different utilities and services in light of functional recovery.
Source: JRC.
Having evaluated the scores for each indicator, the indicator values are used to calculate the key performance indicator score for B.3 (Table 82). B.3. score corresponds to an Acceptable performance class and a performance class score PCSB.3 = 40 (Figure 46).
Table 82. Example of B.3 evaluation.
| Indicator | Wind | Earthquake | Tsunami | Fire | Blast |
| B.3.1 | 40 | 45 | 60 | 95 | 95 |
| B.3.2 | 60 | 75 | 100 | 95 | 95 |
| min(B.3.1+B.3.2) | 100 | — | — | — | — |
| B.3.3 | 65 | ||||
| B.3 | = (0.35 · 40 + 0.35 · 60) + 0.3 · 65 = 54.5 | ||||
| Performance class | Acceptable | ||||
| PCSB.3 | 40 | ||||
Source: JRC.
[1] http://ai2lab.org/tsumapsneam/interactive-hazard-curve-tool/.
[2] https://sealevel.nasa.gov/ipcc-ar6-sea-level-projection-tool.
4.7 Ensuring occupant health, comfort and wellbeing (B.4)
4.7.1 Description and assessment
The Ensuring occupant health, comfort and wellbeing KPI (B.4) looks to evaluate the extent to which the project design provides a healthy environment which supports and promotes physical, social and mental health, and in which the users can easily cater to their needs, have a meaningful experience and thrive.
Four main areas of project design that have been linked to occupant health, comfort and wellbeing are considered within B.4:
- Indoor acoustic environment (B.4.1): extent to which harmful or intrusive noises are prevented and the users are provided with a healthy and productive acoustic environment.
- Lighting environment (B.4.2): extent to which natural and artificial lighting systems support health, wellbeing, orientation, safety and the ability to conduct tasks, for all users.
- Thermal comfort (B.4.3): extent to which the design caters for the thermal comfort of diverse users.
- Promotion of physical movement (B.4.4): extent to which opportunities for physical movement are integrated into the project.
B.4 score is evaluated according to Equation (138).
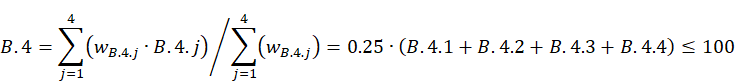
(138)
Each indicator is evaluated with a score between 0-100 and a corresponding indicative performance class (indicator class is provided just to guide users but not used further in the evaluation of KPIs and dimensions), according to adherence with best-practice design guidance, and beyond best-practice standards and guidance that are typically voluntary. The performance class of the B.4 key performance indicator is assessed according to the thresholds in Figure 64.
Figure 64. B.4 performance classes and thresholds.

Source: JRC.
The KPI and its indicators are designed to be implemented at all project scales, types and main uses (Table ). The assessment of B.4.1, B.4.2, B.4.3 and B.4.4 is affected by the project scale and type.
When a project, classified into the neighbourhood or urban scale, involves several buildings with distinct design characteristics, thus likely leading to different indicator scores for each of them, the evaluation of the indicators shall be carried out by identifying representative samples of buildings with similar design features. For each of these representative building designs, a separate assessment should be performed. The overall score per indicator is then estimated as a weighted average of the separate assessment scores, with the weights obtained from the relative occurrence of each building design.
For renovation projects, the assessment focuses on the specific aspects of the building and spaces that are affected by the proposed renovation works. However, when indicators and/or metrics address an aspect that has not been altered by the renovation, their evaluation should consider the as-built state (i.e. condition before the intervention is set), as this affects the user health, comfort and wellbeing.
The definition of the B.4 KPI and indicators draws heavily upon of the following key standards, certification schemes and guidance documents: CEN (2021b), IWBI (2020), Fitwel (2020), PAS 6463 (BSI, 2022) and Level(s) (Dodd et al., 2021e, f, g).
EN 17210 (CEN, 2021b) is a European standard adopted by the 34 member countries of the European Committee for Standardisation. The main goal of the standard is to contribute to the implementation of the UN Convention on the Rights of Persons with Disabilities in Europe (COM, 2010). EN 17210 (CEN, 2021b) is a performance standard, and aims to provide the basic, minimum functional requirements and recommendations for the design, construction, refurbishment or adaptation, and maintenance of an accessible and usable built environment, including guidance on outdoor pedestrian and urban areas. Although adherence to this standard is mandatory for publicly funded projects in the EU, the scope of NEB extends its use to privately funded projects. Hence, in many of the indicators within B4, EN 17210 is adopted in the definition of the Acceptable performance class.
As a performance standard, EN 17210 provides design direction without limiting to a prescribed metric, which allows for greater flexibility for implementation across countries and without the risk of conflicting with other existing standards. National standards or regulations may be used to determine the technical performance criteria and specifications to fulfil the functional requirements of EN 17210. However, if national standards or regulations standards are insufficient or lacking, the supplementary technical reports TR 17621 (CEN, 2021c) and TR 17622 (CEN, 2021a), provide the necessary information on how to meet the performance standard. As the technical performance criteria set out in these reports are typically more stringent than those in most national standards and regulations, compliance with TR 17621 and TR 17622 is adopted in the definition of the Good performance class in many of the indicators within B.4.
WELL v2 (IWBI, 2020) and Fitwel (2020) are two of the few certification schemes that focus on the health and wellbeing of occupants and users. Both define design features and metrics for achieving specific health and wellbeing goals in projects. A number of design features and associated metrics in WELL and Fitwel are adopted in the definition of the Good and Excellent performance classes in the indicators within B.4. Although WELL requires an on-site assessment as part of its certification process, only those metrics that can be evaluated at the design stage are considered here. Both the WELL and Fitwel standards are continuously updated as new research findings are published. Hence, in the evaluation of B.4, the latest versions of these standards should be used.
PAS 6463 (BSI, 2022) provides guidance on the design of the built environment to include the needs of people who experience sensory/neurological processing differences. Such needs are often excluded from existing design standards, and are not fully incorporated in current certification schemes. PAS 6463 aims to help with the design, creation or management of intuitive environments which readily accommodate the neurological variations in the way people perceive, process and organise sensory information, received through hearing, sight, touch, smell or movement. The guidance provided PAS 6463 contributes to the definition are drawn of the Good and Excellent classes for indicators within B.4.
The evaluation of the indicators in B.4 is conducted by the design team, comprising architects, structural engineers and service engineers, potentially seeking the advice of product manufacturers, and main and specialist contractors. The assessment requires the following information to be identified and collected:
- Standards, guidelines and certification scheme documents, as well as any national standards relevant to acoustic, lighting, thermal comfort and active design.
- Information of the project location and orientation, and relevant maps of pedestrian areas, cycle lanes and public transportation.
- Project design plans, architectural and structural design drawings, service plans, (especially lighting and HVAC).
- Plans for the use of different areas of the project, with identification of regularly occupied individual and multi-occupant spaces.
- Information on the type of users and their needs.
- Information of sources of noise outside and inside the building and estimates of their values.
- Characteristics of internal finishes (ceiling, walls, flooring), and manufacturer information regarding the reflectance and acoustic performance of materials.
- Manufacturer information regarding acoustic insulation of the envelope and façades, and regarding any mechanical systems (HVAC) used for cooling or heating.
- Information on provided amenities, with particular focus on those related to physical activity.
4.7.2 Indoor acoustic environment (B.4.1)
The Indoor acoustic environment indicator (B.4.1) evaluates the extent to which the project design provides users with a healthy and productive acoustic environment, that is void of harmful or intrusive noise, and which supports speech intelligibility. The evaluation of the indicator score is summarised in Table 83, based on compliance with best practice standards and beyond best-practice guidance that specifically address users with diverse abilities. The indicator score cannot exceed 100. On some occasions, next to the metrics of the indicator, a “non-applicable” option exists, so that users can indicate that the specific metric is not relevant to the project attributes. If the non-applicable option is selected (when available), the full metric score should be considered in the evaluation of the indicator score, to avoid penalising a project due to non-relevant aspects.
Figure 65 shows indicator thresholds adopted to associate the indicator score to an indicator performance class. While these thresholds and performance classes are not directly applied in the evaluation of KPI and dimension scores and performance classes, they are included here to assist users in determining appropriate performance levels for specific project aspects and to offer clear guidance on their improvement.
Table 83. B.4.1 score.
| Metric | Score | Non-applicable1 |
| Select single value below: | ||
| The project does not comply with EN 17210 (CEN, 2021b) Section 15.2 Acoustics | B.4.1 = 0. No further points to be added. | |
| The project complies with EN 17210 Section 15.2 Acoustics. | Check next metrics. | |
| Compliance with EN 17210 is demonstrated through (single selection allowed): | ||
| Compliance is demonstrated through use of national guidance and regulations with acoustic design criteria that are less stringent than TR 17621 (CEN, 2021c). | +20 | |
| Compliance is demonstrated through use of TR 17621, or national guidance and regulations with equally (or more) stringent acoustic design criteria. | +40 | |
| The project also complies with the following WELL v2 (IWBI, 2020) features (multiple selections allowed): | ||
| S03 Sound barriers – Part 1: Design for sound isolation at walls and doors | +10 | |
| S04 Reverberation time-option 1 | +10 | ☐ |
| S05 Sound reducing surfaces | +10 | ☐ |
| S06 Minimum background sound - Part 1 | +10 | ☐ |
| S07 Impact noise management – Part 1 | +10 | |
| S08 Enhanced audio devices – Part 1 | +10 | |
| The project also complies with the following criteria from PAS 6463 (BSI, 2022) (multiple selections allowed): | ||
| Acoustic zoning is used to allow people to make a gradual transition from the quietest to the noisiest space within a building | +5 | |
| Quieter spaces, including enclosed quiet rooms and semi-enclosed quieter zones, are provided as options to escape if a noisy over-stimulating environment becomes intolerable | +5 | |
| Individual control for noise is provided through (a) the ability to switch extractor fans on or off, and (b) the option to close windows or ventilator panels when noise comes from the street | +5 | ☐ |
| Indicator score = Σ(metric scores) | ≤ 100 | |
1 If the non-applicable option is selected (when available), the full metric score is considered in the evaluation of the indicator score.
Source: JRC.
Figure 65. B.4.1 indicative performance classes and thresholds.

Source: JRC.
Excessive noise seriously harms human health and interferes with people’s daily activities at school, at work, at home and during leisure time. Many health consequences of exposure to excessive noise have been identified, such as sleep disturbance, cardiovascular and psychophysiological issues, performance reduction and changes in social behaviour (WHO, 2011). The importance of protecting citizens from noise is recognised in European policy, with Directive (2002) on the assessment and management of environmental noise. Typically, noise problems that affect health and wellbeing within an indoor space result from (Dodd et al., 2021g; IWBI, 2020):
- Too much noise outside the building entering the space (typically this includes noise from air traffic, rail, road traffic congestion, industrial works and processes, construction, public works etc.).
- Too much noise from activities adjacent to the space, including:
- Airborne noise (generated in the air and transmitted by air, such as sounds from speech, radio, television etc. in adjacent spaces or buildings).
- Impact noise (generated by physical interaction with the building structure causing it to vibrate. Examples include footfall, exercise or mechanical equipment vibration that can create uncomfortable environments for occupants located nearby).
- Too much noise from service equipment or occupants in the space itself (e.g. sound from HVAC equipment, appliances and other occupants).
- Lack of sound control and inappropriate reverberation times (see later definition) in the space.
Even when not at harmful levels, too much noise may affect speech intelligibility and can be distracting, reducing functionality, productivity and enjoyment of spaces. An acoustic environment where all users can distinguish essential sounds (primary sounds) from general background noise (ambient noise other than primary sounds) is essential. In particular, people with hearing and cognitive impairments, can have difficulties in making out sounds and words in noisy environments (CEN, 2021b).
Evaluation of the appropriateness of an indoor acoustic environment depends on the use, occupancy type and level of the space being designed, as well as a number of interacting design features, including sound isolation provided by façades and partitioning elements (e.g. walls and floors), surface shapes and finishing materials, indoor acoustic design and noise and vibration mitigation of service equipment. EN 17210 (CEN, 2021b) sets out performance objectives for indoor acoustic environments considering all these aspects, and specifically considers speech transmission and intelligibility. This standard is considered best-practice for acoustic environment design. Non-compliance with this performance standard results in an indicator score of 0 (indicative of Low performance in Figure 65).
An Acceptable performance class is based (at a minimum) on compliance with EN 17210 using national guidelines. A performance class exceeding the Acceptable can be achieved by demonstrating compliance with the EN 17210 performance criteria, using the material and element specifications as well as threshold values of acoustic environment metrics as defined in TR 17621 (CEN, 2021c) (or alternative national guidance that provides equal or more stringent criteria than TR 17621 for all aspects of the acoustic design).
Higher indicator scores can also be achieved by implementing selected relevant guidance and thresholds in WELL v2 (IWBI, 2020) and PAS 6463 (BSI, 2022) that ensure acoustic comfort for people with diverse abilities and neurodiversity. These include more stringent values for background noise, the use of dedicated artificial sound to uniformly increase speech privacy between occupied spaces (i.e. sound masking), and provision of enhanced user control over noise.
To characterise the level of noise from external sources, the Level(s) approach (Dodd et al., 2021g) for the evaluation of the noise levels at the façade of a building may be used. Level(s) state that the yearly average noise level (with a daily penalty distribution) or the maximum noise level can be estimated according to the calculation method described in Annex II of Directive (2002).
Background noise levels combine noise penetration from outside and inside sources of noise. Several acoustic software models exist for the prediction of indoor noise levels. Alternatively, predictions may be based on the sound insulation properties of the façades and reverberation times of the receiving rooms using a building element approach (e.g. ISO 12354-3, ISO, 2017a).
Thresholds of background noise levels are defined differently in the reference standards for different occupancy and uses of the space. Hence, at design stage, it is necessary to map the likely uses of the different spaces within a project. The WELL v2 (IWBI, 2020) certification system proposes the following five acoustic categories for spaces:
- Loud zone: includes areas intended for loud equipment or activities (e.g. mechanical rooms, AV/IT closets, kitchens, fitness rooms, social spaces, recreational rooms, music rooms).
- Quiet zone: includes areas intended for concentration, wellness, rest, study and/or privacy (e.g. restorative spaces, lactation rooms, nap rooms).
- Mixed zone: includes areas intended for learning, collaboration and/or presentation (e.g. auditoriums, classrooms, breakout spaces).
- Circulation zone: includes occupiable areas not intended for regular occupancy (e.g. hallways, egress, atria, stairs, lobbies)
- Not applicable zones: includes other areas without significant sources of sound (e.g. storage rooms, janitor rooms, coat closets) that are not regularly occupied.
Key parameters adopted by the referenced standards and guidelines for determining the acoustic environment and speech intelligibility of a space, are the reverberation time (T) and speech transmission index (STI).
The reverberation time (T) is the time, in seconds (sec), that would be required for the sound pressure level to decrease by 60 dB after the sound source has stopped. The reverberation time is strongly dependent on the frequency of the sound and the absorptive properties of the materials in the space assessed. As stated in Level(s), the chosen frequency range for the reverberation time is often in 1/1 octave bands of 125 or 250Hz to 4kHz for rooms where people work, rest or stay for more than a few minutes (Dodd et al., 2021g). For rooms where people simply pass through, like hallways and staircases, the frequency range in octave bands is often 500Hz to 2kHz (Dodd et al., 2021g). The sound absorption of the room can be characterised by the equivalent absorbing area (Aeq) of the room. The reverberation time (T), and the equivalent sound absorption area (Aeq), can be estimated using EN 12354-6 (CEN, 2003), based on volume and sound absorption data. The latter can be estimated from material specifications, or from standards and guidelines (e.g. absorption coefficients for common surfaces in buildings and for objects are provided in Annex B and C of EN 12354-6, respectively).
The speech transmission index (STI) is described in IEC 60268-16 (IEC, 2020) and quantifies the transmission of the speech signal between a speaker and a listener. This can be evaluated using various available acoustic environment planning software.
Threshold (or ranges of) values for T and STI are included in national guidance in accordance with the use and occupancy type and level of the space being assessed. Such threshold values may be used to achieve the performance levels required by EN 17210 (CEN, 2021b). Alternatively, the typically more demanding threshold values set out in TR 17621 (CEN, 2021c) and WELL v2 (IWBI, 2020) may be used to increase the acoustic environment indicator score.
4.7.3 Lighting environment (B.4.2)
The Lighting environment indicator (B.4.2) evaluates the extent to which the project adopts a natural and artificial lighting system that supports health, wellbeing, orientation, safety and the ability to conduct tasks, for all users.
The evaluation of the indicator score is summarised in Table 84, based on compliance with best practice standards and beyond best-practice guidance that specifically address users with diverse abilities. The indicator score cannot exceed 100. On some occasions, next to the metrics of the indicator, a “non-applicable” option exists, so that users can indicate that the specific metric is not relevant to the project attributes. If the non-applicable option is selected (when available), the full metric score should be considered in the evaluation of the indicator score, to avoid penalising a project due to non-relevant aspects.
Figure 66 shows indicator thresholds adopted to associate the indicator score to an indicator performance class. While these thresholds and performance classes are not directly applied in the evaluation of KPI and dimension scores and performance classes, they are included here to assist users in determining appropriate performance levels for specific project aspects and to offer clear guidance on their improvement.
Table 84. B.4.2 score.
| Metric | Score | Non-applicable1 |
| Select single value below: | ||
| The project does not comply with the EN 17210 (CEN, 2021b) sections listed below. | B.4.2 = 0. No further points to be added. | |
| The project complies with the following EN 17210 sections:2 | Check next metrics. | |
| 6.3.4 Wayfinding - visual contrast | ||
| 9.1.8 Entrances | ||
| 9.2.14 Lighting in corridors and passageways | ☐ | |
| 10.1.11 Lighting of ramps and landings | ☐ | |
| 10.2.8 Lighting of steps and stairs | ☐ | |
| 10.4.9 Lighting of lifts | ☐ | |
| 11.1.9 Service counters for information, ticketing and reception | ☐ | |
| 15.1 Lighting | ||
| Compliance with EN 17210 is demonstrated through (single selection allowed): | ||
| Compliance is demonstrated through use of national guidance and regulations with lighting design criteria that are less stringent than TR 17621 (CEN, 2021c). | +20 | |
| Compliance is demonstrated through use of TR 17621, or national guidance and regulations with equally (or more) stringent lighting design criteria | +40 | |
| The project also complies with the following WELL v2 (IWBI, 2020) features (multiple selections allowed): | ||
L01 Light exposure L02 Visual lighting design L04 Electric light glare control L05 Daylight design strategies with Tier 1 or Tier 2 requirements L06 Daylight simulation with Tier 1 or Tier 2 requirements L07 Visual balance L08 Electric light quality L09 Occupant lighting control: Part 1 with Tier 1 requirements & Part 2 (2) or Part 1 with Tier 2 requirements & Part 2 (2) | +5 +5 +5 +5 or +7.5 +5 or +7.5 +5 +5 +5 or +7.5 | |
| The project also complies with the following criteria from PAS 6463 (BSI, 2022): | ||
| Buzzing or humming noises from lighting is avoided. These may occur with LED luminaires or when lighting is operating at a dimmed level of intensity. In areas used for relaxation or rest, lighting correlated colour temperature (CCT) is adjustable or 2700-3000K. | +5 | |
| Indicator score = Σ(metric scores) | ≤ 100 | |
1 If the non-applicable option is selected (when available), the full metric score is considered in the evaluation of the indicator score.
2 If the section of EN 17210 does not apply to the project (i.e. non-applicable is selected), then as long as all other stated sections are complied with, then the project is deemed to be in compliance with EN 17210.
Source: JRC.
Figure 66. B.4.2 indicative performance classes and thresholds.

Source: JRC.
Key factors to provide visual conditions to support visual tasks, orientation and safety, include: level of illumination of horizontal and vertical surfaces, limitation of glare from a light source or reflections, uniformity and luminance distribution, direction of lighting and shading, and colour. EN 17210 (CEN, 2021b) sets out performance objectives for lighting related criteria in several sections of the standard, covering both indoor and external lighting. These relate to how lighting contributes to wayfinding, safety and the lighting needs of different users to conduct visual tasks. Approaches to the reduction of glare are provided, and the standard promotes users being able to adjust lighting environments. Moreover, EN 17210 promotes the consultation with users to identify their needs for the lighting environment.
The EN 17210 standard is considered best-practice currently for lighting environment design. Non-compliance with this performance standard results in an indicator score of 0 (indicative of Low performance in Figure 66).
An Acceptable performance class is based (at a minimum) on compliance with EN 17210 using national guidelines. A performance class exceeding Acceptable can be achieved by demonstrating compliance with the EN 17210 using metrics as defined in TR 17621 (CEN, 2021c) (or alternative national that provides equal or more stringent criteria than TR 17621 for all aspects of the lighting environment design).
Higher indicator scores can also be achieved by implementing selected relevant guidance and thresholds in WELL v2 (IWBI, 2020), PAS 6463 (BSI, 2022) and Fitwel (2020). These consider lighting environments for people with diverse abilities and neurodiversity. They include even more stringent values for minimum light levels provided for various tasks, but specifically aim to promote the use of lighting systems (natural and artificial) that contribute to physical and mental wellbeing.
For compliance with EN 17210 (CEN, 2021b), TR 17621 (CEN, 2021c) calls upon a number of other standards. In particular, EN 13201-2 (CEN, 2015a) — Road Lighting — is called upon for outdoor lighting. This standard defines lighting performance objectives on the basis of lighting classes, which are based on the type of vehicle and road/pathway type. Highlighted lighting classes include class P and HS which are for pedestrians and pedal cyclists on footways and cycleways etc. The SC class is an additional class for use in high crime areas, where public lighting is needed for the identification of people. Calculation approaches for meeting the performance objectives are provided in EN 13201-3 (CEN, 2015b).
A space is considered to provide adequate daylight if a target illuminance (Ē) level is achieved across a fraction of the reference plane within a space for at least half of the daylight hours. The reference plane of the space is located 0.85 m above the floor, unless otherwise specified (EN 17037, CEN, 2021e). The adequacy of daylight provision to an interior space can be calculated as per EN 17037 section 5.1.3, using a method based on daylight factors (Method 1), or through simulation (Method 2). Annex A in EN 17037, provides the minimum target illuminances (and corresponding daylight factors) for spaces with different uses, that can be adopted to determine the appropriateness of the lighting. It is noted that many standards and guidelines adopt daylight factors as proxies for illuminance (e.g. Active House Alliance, 2020). However, calculating daylight factors (Method 1) requires complex repetition of calculations, and thus generally undertaken using a professional lighting design software.
For indoor artificial lighting TR 17621 (CEN, 2021c) calls upon EN 12464-1: (CEN, 2021g) for the lighting of workplaces, which specifies requirements for lighting solutions for most indoor workplaces and their associated areas in terms of quantity and quality of illumination. This standard defines minimum illuminance levels (Ēmin) and uniformity of illuminance (Uo) for different space uses. It also provides guidance on ranges of surface reflectance to achieve good illuminance and contribute to room brightness. Again, professional lighting calculation software may be used for the illuminance calculation.
Glare is a negative sensation caused by bright areas with sufficiently greater luminance than the luminance to which the eyes are adapted, producing annoyance, discomfort or loss in visual performance and visibility (EN 17037, CEN, 2021e). The perception of glare is dependent on the luminance distribution in the field of view and is therefore strongly dependent on the spatial position and the line of sight of the occupant. A simplified approach to consider glare is the daylight glare probability (DGP) presented in EN 14501 (CEN, 2021d). DGP is used to assess protection from daylight glare in spaces where the activities are comparable to reading, writing or using display devices, and where the occupants are not able to choose position and viewing direction. For determination of glare from artificial lighting instead, the methodology defined in CIE 117 (CIE, 1995) may be used. This uses the unified glare rating (UGR) as a measure of potential discomfort glare experienced by an occupant in interior lighting spaces.
4.7.4 Thermal comfort (B.4.3)
The thermal comfort indicator (B.4.3) evaluates the extent to which the design caters for the thermal comfort of diverse users. The evaluation of the indicator score is summarised in Table 85, based on compliance with the best-practice standard WELL v2 (IWBI, 2020) that specifically accounts for users with diverse abilities. The indicator score cannot exceed 100. On some occasions, next to the metrics of the indicator, a “non-applicable” option exists, so that users can indicate that the specific metric is not relevant to the project attributes. If the non-applicable option is selected (when available), the full metric score should be considered in the evaluation of the indicator score, to avoid penalising a project due to non-relevant aspects. Figure 67 shows indicator thresholds adopted to associate the indicator score to an indicator performance class. While these thresholds and performance classes are not directly applied in the evaluation of KPI and dimension scores and performance classes, they are included here to assist users in determining appropriate performance levels for specific project aspects and to offer clear guidance on their improvement.
Measuring thermal comfort in buildings typically involves assessing people’s levels of comfort relative to several parameters describing the environment (e.g. air temperature, relative humidity and air velocity). These in turn depend on project design features such as site location and project orientation with respect to the sun and prevailing winds, building envelope materials and design, use of natural ventilation, use of shading, and use of heating and cooling systems, amongst others. The feeling of comfort, however, is subjective, and depends on people’s physiology, the activity they are doing and what they are wearing. There is therefore no one-fits-all solution, and the aim in designing for thermal comfort is not to ensure thermal comfort for all, but rather to provide a baseline satisfaction for the largest number of people while providing people some level of thermal control to adjust their thermal comfort level where possible. It is also important to note the connection between provision of indoor thermal comfort and energy use. Over 80% of the energy used in EU households in 2022 was for heating, cooling and hot water (Eurostat, 2024). Hence, energy consumption must be considered in addition to the provision of thermal comfort in design (see 3.4 in Sustainability chapter).
One of the most used parameters to evaluate thermal comfort is the predicted mean vote (PMVo), which was developed by the American Society of Heating, Refrigerating and Air-conditioning Engineers (ASHRAE). The parameter uses the fact that human body temperature is maintained at optimum levels (37 degrees) through heat exchange between the human body and the environment by convection, radiation, and evaporation (ASHRAE, 2023). PMVo relates the imbalance between the actual heat flow from the body into a given environment and the heat flow required for optimum comfort. PMVo is evaluated through a set of semi-empirical equations, and is supposed to represent the mean response of a large group of people according to the ASHRAE 55 thermal sensation scale (ASHRAE, 2023). The ASHRAE 55 scale has seven comfort ratings, ranging from hot (PMVo = 3) to cold (PMVo = –3), with a comfortable environment deemed to be one where PMVo values lie between –1 and 1. PMVo is one of the parameters adopted in WELL v2 (IWBI, 2020) T01 criterion, which in turn provides the threshold for the Acceptable performance class in B.4.3.
Table 85. B.4.3 score.
| Metric | Score |
| Select single value below: | |
| The project does not comply with any of the following WELL v2 (IWBI, 2020) criteria. | B.4.3 = 0. No further points to be added. |
| The project complies with the following WELL v2 criteria | Check next metrics. |
| WELL v2 criteria (multiple selections allowed): | |
| T01 Thermal performance – Part 1 | +40 |
| T03 Thermal zoning | +15 |
| T05 Radiant thermal comfort | +15 |
| T07 Humidity control | +15 |
| T08 Enhanced operable windows | +15 |
| T09 Outdoor thermal comfort – Part 1 | +15 |
| Indicator score = Σ(metric scores) | ≤ 100 |
Source: JRC.
Figure 67. B.4.3 indicative performance classes and thresholds.

Source: JRC.
4.7.5 Promotion of physical movement (B.4.4)
The Promotion of physical movement indicator (B.4.4) evaluates the extent to which the design encourages physical movement where there are such opportunities. The evaluation of the indicator score is summarised in Table 86, based on guidance provided as part of the WELL v2 Movement (IWBI, 2020), which aims to promote movement, foster physical activity and active living and discourage sedentary behaviour, by creating and enhancing opportunities through living spaces where we spend our lives. WELL v2 (IWBI, 2020) also specifically addresses users with diverse abilities. The indicator score cannot exceed 100. On some occasions, next to the metrics of the indicator, a “non-applicable” option exists, so that users can indicate that the specific metric is not relevant to the project attributes. If the non-applicable option is selected (when available), the full metric score should be considered in the evaluation of the indicator score, to avoid penalising a project due to non-relevant aspects. Figure 68 shows indicator thresholds adopted to associate the indicator score to an indicator performance class. While these thresholds and performance classes are not directly applied in the evaluation of KPI and dimension scores and performance classes, they are included here to assist users in determining appropriate performance levels for specific project aspects and to offer clear guidance on their improvement.
The design requirements of WELL v2 (IWBI, 2020) and Fitwel (2020) included in B.4.4 promote circulation in the inside and outside of buildings, and provide opportunities for reducing sedentary behaviour through appropriate furnishings, also promoting better posture.
Table 86. B.4.4 score.
| Metric | Score | Non-applicable1 |
| Select single value below: | ||
| The project does not comply with any of the following WELL v2 (IWBI, 2020) criteria (i.e. V02–V08). | B.4.4 = 0. No further points to be added. | |
| The project complies with the following WELL v2 criteria (i.e. V02–V08). | Check next metrics. | |
| WELL v2 criteria V02–V08 (multiple selections allowed): | ||
| V02 Ergonomic workstation design – Parts 1-4 | +15 | ☐ |
| V03 circulation network2 | +15 | |
| V04 Facilities for active occupants | +15 | |
| V05 Site planning and selection | +15 | |
| V07 Active furnishings with Tier 1 or Tier 2 requirements | +15 or +20 | ☐ |
| V08 Physical activity spaces and equipment (both Parts 1 and 2) | +20 | |
| The project also complies with the following criterion: | ||
| Fitwel 8.7 Multi-purpose room (Fitwel 2020) | +15 | |
| Indicator score = Σ(metric scores) | ≤ 100 | |
1 If the non-applicable option is selected (when available), the full metric score is considered in the evaluation of the indicator score.
2 Effort should be made to provide stairs as close as possible to the lifts, to reduce separation and provide a similar journey for people using the stairs and people using the lifts. Lifts should be easy to locate with appropriate wayfinding and signage. It should be ensured that any enhanced feature of the stair, such as music, artwork or game, does not create a safety hazard, disturbance or distraction to users who may be negatively impacted.
Source: JRC.
Figure 68. B.4.4 indicative performance classes and thresholds.

Source: JRC.
4.7.6 Example (B.4)
A four-storey residential building is to be designed (newbuild project type) in an urban area of Lisbon, Portugal. The assessment is carried out at the building scale and no listed cultural heritage is affected by the project. The building has a plan of 23.5 m by 23.5 m. The building has a symmetrical and identical repeated floor plan on each floor, with each façade made up of 5 rooms (i.e. 16 perimeter rooms, as corner rooms have two façades). The building is composed of a reinforced concrete frame with façades made of double brickwork with air cavity. A central lift and stairwell are located at the centre of the building plan.
External sources of noise mainly include road traffic. On average, 10 000 vehicles per day use the residential roads around the building, with 10% being heavy vehicles. 15% of the daytime traffic is on average using the roads at night. The A-weighted long-term average sound pressure levels for the day, night and evening are calculated in octave bands according to Annex II of Directive (2002). The estimated outdoor free field sound pressure level is calculated as 50 dB. The sound pressure level 2 m from the façade of the building is found to be 53 dB.
The formulation in equation E.2 of ISO 12354-3 (ISO, 2017a) is used to evaluate the indoor sound pressure level, standardised to 0.5 sec reverberation time. This value is calculated from the standardised level difference of the façade as per equation 4 of ISO 12354-3, which in turn is evaluated from estimates of the sound reduction index of the façade and the receiving room size. The building is composed of a reinforced concrete frame with façades made of double brickwork with air cavity, with surface mass of 400 kg/m2. A typical room along the centre of the façade of the building has a volume of 50 m3, a façade of 11.3 m2, and contains a 4.5 m2 window with double glazing that is partially openable, with an acoustically treated air inlet located above the window. Sound reduction indices for each façade element are adopted from ISO 12354-3 and the calculation procedure shown in example G.1 of ISO 12354-3 is followed. This results in a standardised level difference of the façade of 29 dB and hence an indoor sound pressure level of 24 dB (i.e. = 53 – 29). The room is equipped with a mechanical ventilation system that produces an additional 10 dB of background noise, resulting in a total of 34 dB background noise. This is considered low and meets the criteria of TR 17621 (CEN, 2021c). It also lies below the threshold for maximum background noise for dwellings stated in WELL v2 (IWBI, 2020).
The reverberation time is calculated as per equation 5 of EN 12354-6 (CEN, 2003). Considering the 50 m3 room used in the above example, it has usable dimensions (length, width, height) of 4.42 m, 4.70 m and 2.40 m. The floors and ceilings are made of concrete and the walls of plastered brick. There is one window (as previously described) and a door of height and width equal to 2.04 m and 0.93 m, respectively. The floor has a soft layer with a depth of greater than 10mm. The values for the absorption of materials are obtained from Annex B of EN 12354-6 and the total equivalent absorption area is calculated as per section 4.3 in EN 12354-6, considering an empty room. This is shown in Table 87 for the frequency of 1000 Hz, resulting in a reverberation time of 1 sec. This does not meet the requirements in WELL v2 SO4 (IWBI, 2020). However, the STI is also calculated using an acoustic environment planning software, resulting in compliance with the values provided in TR 17621 (CEN, 2021c).
Table 87. Calculation of equivalent absorption area for a typical room.
| Element | Area (m2) [1] | Absorption coefficient [2] | [1] x [2] (m2) |
| Ceiling | 20.77 | 0.02 | 0.415 |
| Floor | 20.77 | 0.30 | 6.231 |
| Walls minus door and window | 37.38 | 0.02 | 0.748 |
| Door | 1.89 | 0.08 | 0.151 |
| Window | 4.50 | 0.04 | 0.180 |
| Equivalent absorption area (Aeq) = | 7.725 | ||
Source: JRC.
The calculation is repeated for all rooms and spaces in the building plan and compliance with EN 17210 (CEN, 2021b) using the criteria of TR 17621 (CEN, 2021c) is demonstrated. Interior walls meet the sound transmission class values in WELL v2 (IWBI, 2020) S03 Part 1. The noise reduction coefficient (NRC) rating (WELL v2 S05) is calculated as the arithmetic average of the absorption coefficients at 250, 500, 1000, and 2000 Hz octave bands (obtained for the used materials from Annex B of EN 12354-6, CEN, 2003), rounded to the nearest multiple of 0.05. For the ceilings of the typical room, which is made of concrete, NRC is 0.014 (which rounded to the nearest non-zero 0.05, is 0.05). Although, this falls below any of the recommended values for WELL v2 (IWBI, 2020) S05, as the building is residential, composed of dwelling units, WELL v2 (IWBI, 2020) S04, S05 and S06 do not apply, and these criteria are given full scores. An approximate impact insulation class (IIC) rating of 75 is obtained from Warnock (1999) for concrete floors with carpet and underlay, and is seen to comply with the requirements of WELL v2 Impact noise management – Part 1 (IWBI, 2020). No enhanced audio devices are used in the building (hence, no compliance with the WELL v2 (IWBI, 2020) S08 requirements). Finally, individual control for noise is provided throughout the building by allowing users to switch extractor fans on or off and close windows or ventilator panels when noise comes from the street.
B.4.1 score is evaluated in Table 88 (corresponding to Excellent performance for this indicator).
Table 88. Example of B.4.1 evaluation.
| Metric | Score | Non-applicable1 |
| Select single value below: | ||
| The project does not comply with EN 17210 (CEN, 2021b) Section 15.2 Acoustics | x | |
| The project complies with EN 17210 Section 15.2 Acoustics. | √ Check next metrics. | |
| Compliance with EN 17210 is demonstrated through (single selection allowed): | ||
| Compliance is demonstrated through use of national guidance and regulations with acoustic design criteria that are less stringent than TR 17621 (CEN, 2021c). | 0 | |
| Compliance is demonstrated through use of TR 17621, or national guidance and regulations with equally (or more) stringent acoustic design criteria. | +40 | |
| The project also complies with the following WELL v2 (IWBI, 2020) features (multiple selections allowed): | ||
| S03 Sound barriers – Part 1: Design for sound isolation at walls and doors | +10 | |
| S04 Reverberation time-option 1 | +10 | ☒ |
| S05 Sound reducing surfaces | +10 | ☒ |
| S06 Minimum background sound - Part 1 | +10 | ☒ |
| S07 Impact noise management – Part 1 | +10 | |
| S08 Enhanced audio devices – Part 1 | 0 | |
| The project also complies with the following criteria from PAS 6463 (BSI, 2022) (multiple selections allowed): | ||
| Acoustic zoning is used to allow people to make a gradual transition from the quietest to the noisiest space within a building | 0 | |
| Quieter spaces, including enclosed quiet rooms and semi-enclosed quieter zones, are provided as options to escape if a noisy over-stimulating environment becomes intolerable | 0 | |
| Individual control for noise is provided through (a) the ability to switch extractor fans on or off, and (b) the option to close windows or ventilator panels when noise comes from the street | +5 | ☐ |
| Indicator score = Σ(metric scores) | 95 | |
1 If the non-applicable option is selected (when available), the full metric score is considered in the evaluation of the indicator score.
Source: JRC.
The adequacy of the lighting environment is checked with respect to EN 17210 clause 15.1 Lighting (CEN, 2021b) for the typical 50 m3 room. The 4.5 m2 window for this specific room is south-facing and is equipped with blinds that have an electric control. The room is used as a bedroom with a home office space, and equipped with 8 LED lights with colour temperature of 2000 k, spaced in a symmetrical grid evenly across the ceiling. The lights are dimmable, make no noise when dimmed and extra light fixtures are available, meeting the WELL v2 L09 Occupant lighting control criteria – Parts 1 and 2 (IWBI, 2020), as well as PAS 6463 (BSI, 2022). The reflectance of the white painted concrete ceiling, brick walls and carpeted floor are 0.6, 0.3 and 0.2, respectively. These are close but outside the recommended ranges specified in EN 12464-1 (CEN, 2021g).
Considering the room dimensions, a grid of 0.5 m is used for the daylight and artificial illuminance calculation. A lighting calculation software is adopted to calculate the daylight factor for the grid and the illuminance due to artificial light for this grid, considering lighting positions and surface reflectance. The adopted tool used ray tracing to perform all lighting calculations.
Daylight factors ranging between 4.3% and 4.9% are calculated across the room. The target daylight illuminance is obtained from EN 17037 table A.2 (CEN, 2021e) as 750 lx, which according to EN 17037 table A.3 for Lisbon requires the daylight factor higher than 4.1%. As all values of daylight factor exceed this minimum value, the illuminance is deemed adequate according to TR 17621 (CEN, 2021c). WELL v2 L01 Light exposure (IWBI, 2020) requires a minimum illuminance of 205 lx over 30% of the floor area for 50% of the daylit hours of the year. This is deemed to be satisfied, as the 16 rooms that run along the façade of the building have a floor area of 315 m2 (i.e. 4.2m · 4.7 m · 16.0 m) and make up 57% of the area of each floor. Hence, more than 30% of the regularly occupied rooms are within a 6 m distance to envelope glazing at each floor. Moreover, the envelope glazing is equal to 90m2 (4.5m2 · 5 · 4) which corresponds to 16% of the regularly occupied floor area (552 m2 per floor), which in turn exceeds the 7% threshold set in WELL v2 (IWBI, 2020). These values satisfy WELL v2 L01 Options 1-3, L05 Part 1 Tier 1, and L06 Tier 1.
EN 12464-1, clause 7 (CEN, 2021g) provides minimum requirements for the maintained illuminance (Ēm) and minimum illuminance uniformity (Uo) depending on the tasks and/or activities being performed in the space. The following minimum values are obtained from Clause 7.3 table 34 Ref. No. 34.2 Writing, typing, reading, data processing: Ēm = 500 lx, U = 0.6. As the room may be used by people who have a below normal visual capacity, and who will work in the space for long periods of time, an enhanced minimum Ēm of 1000 lx is required. The provided artificial light provides illuminance in the range 1300–1500 lx, and the lighting uniformity is 0.8. The lighting system therefore meets the lighting provision requirements of TR 17621 (CEN, 2021c). The WELL v2 L07 minimum uniformity threshold is exceeded (IWBI, 2020), a lighting automation system is not used, and horizontal and vertical luminance contrast ratios are no more than 10:1 between adjacent independently controlled zones, meaning that this WELL v2 (IWBI, 2020) criterion is satisfied.
The blinds used on the window have a low light transmittance and meet the criteria of Class 3 performance according to table E.3 in EN 14501 (CEN, 2021d). According to this standard, this has a ‘good effect’ on glare control, night privacy, visual contact with the outside and daylight utilisation, with no light perceived at incident light levels higher than or equal to 30 000 lx. The daylight glare probability (DGP) is calculated according to EN 17037 (CEN, 2021e) to be between 0.35 and 0.40, which according to table E.1 in EN 14501 (CEN, 2021d) results in glare being perceived but being mostly not disturbing.
For the artificial lighting, the unified glare rating (UGR) tabular method detailed in CIE 117 (CIE, 1995) and in CIE 190 (CIE, 2010) is adopted. UGR is found equal to 17, which is below the maximum limit of 19 stated in table 34 of section 7.3 (CIE, 2010). However, this value is higher than the maximum value of 16 specified in WELL v2 L04 criterion (IWBI, 2020). The colour rendering quality of the lighting also does not meet the criteria of WELL v2 L08 criterion.
The calculation is repeated for each room in the building, considering their specific use, natural and artificial lighting system. It is found that all rooms meet the lighting requirements of EN 17210 (CEN, 2021b) according to the approach and thresholds stated in TR 17621 (CEN, 2021c). Moreover, lighting in the corridors, passageways, lifts, entrances and lifts are similarly found to comply with TR 17621. Lighting in kitchens and bathroom areas comply with the Illuminating Engineering Society (IES) Lighting application standard (IES, 2020), meeting the criteria for WELL v2 L02 criterion for dwelling units (IWBI, 2020).
B.4.2 score is evaluated in Table 89 (corresponding to Good performance for this indicator). For this building, a reduction in glare from artificial lighting could increase the score such that it would reach the Excellent performance class.
Table 89. Example of B.4.2 evaluation.
| Metric | Score | Non-applicable1 |
| Select single value below: | ||
| The project does not comply with the EN 17210 (CEN, 2021b) sections listed below. | x | |
| The project complies with the following EN 17210 sections:2 | √ Check next metrics. | |
| 6.3.4 Wayfinding - visual contrast | ||
| 9.1.8 Entrances | ||
| 9.2.14 Lighting in corridors and passageways | ☐ | |
| 10.1.11 Lighting of ramps and landings | ☐ | |
| 10.2.8 Lighting of steps and stairs | ☐ | |
| 10.4.9 Lighting of lifts | ☐ | |
| 11.1.9 Service counters for information, ticketing and reception | ☒ | |
| 15.1 Lighting | ||
| Compliance with EN 17210 is demonstrated through (single selection allowed): | ||
| Compliance is demonstrated through use of national guidance and regulations with lighting design criteria that are less stringent than TR 17621 (CEN, 2021c). | 0 | |
| Compliance is demonstrated through use of TR 17621, or national guidance and regulations with equally (or more) stringent lighting design criteria | +40 | |
| The project also complies with the following WELL v2 (IWBI, 2020) features (multiple selections allowed): | ||
L01 Light exposure L02 Visual lighting design L04 Electric light glare control L05 Daylight design strategies with Tier 1 or Tier 2 requirements L06 Daylight simulation with Tier 1 or Tier 2 requirements L07 Visual balance L08 Electric light quality L09 Occupant lighting control: Part 1 with Tier 1 requirements & Part 2 (2) or Part 1 with Tier 2 requirements & Part 2 (2) | +5 +5 0 +5 +5 +5 0 +7.5 | |
| The project also complies with the following criteria from PAS 6463 (BSI, 2022): | ||
| Buzzing or humming noises from lighting is avoided. These may occur with LED luminaires or when lighting is operating at a dimmed level of intensity. In areas used for relaxation or rest, lighting correlated colour temperature (CCT) is adjustable or 2700-3000K. | +5 | |
| Indicator score = Σ(metric scores) | 77.5 | |
1 If the non-applicable option is selected (when available), the full metric score is considered in the evaluation of the indicator score.
2 If the section of EN 17210 does not apply to the project (i.e. non-applicable is selected), then as long as all other stated sections are complied with, then the project is deemed to be in compliance with EN 17210.
Source: JRC.
Thermal comfort is calculated for the typical 50 m3 room. The room is mechanically ventilated and equipped with central heating.
The first parameter to calculate is the predicted mean vote (PMVo). Assuming limited activity inside the residence, the rate of metabolic energy production (M) is assumed equal to 58.2 Watt/m2 and the rate of mechanical work (W) is zero. The mean radiant temperature (Tmr) is the uniform temperature of an imaginary black enclosure in which radiant heat transfer from a person equals the radiant heat transfer in the actual enclosure. The value of Tmr can be calculated from knowledge of the temperature of each surface in a room and the position of a person relative to the surfaces, following the approach in ASHRAE 55 (ASHRAE, 2023). In this example, Tmr is estimated equal to 23 OC. The water vapour pressure equals 1.419 kPa and the user is assumed fully clothed. The speed of air, circulating throughout the building space, is 0.1 m/s. This results in a PMVo of –0.202 (comfortable environment). PMVo is calculated for all spaces in the building, and it is observed that PMVo values between +0.5 and –0.5 exist for more than 90% of the regularly occupied spaces. Hence WELL v2 (IWBI, 2020) T01 – Part 1 is satisfied.
The typical room is equipped with a thermostat which can be used to regulate the temperature. The room forms a thermal zone, as do the other rooms on the floorplan with similar layout and area. The room floor area is less than the 60.4 m2 limit for thermal zone definitions in WELL v2 T03 criterion (IWBI, 2020).
At least 50% of the regularly occupied project area is heated and cooled with radiant panels, but these do not cover at least half of the wall to which they are attached. Hence, WELL v2 (IWBI, 2020) T05 criterion is satisfied.
The relative humidity in moist air is the ratio of partial vapor pressure to air pressure. The room relative humidity is modelled with computational fluid dynamics (CFD) software, and is found to be 35% for 98% of all business hours of the year. Moreover, the mechanical ventilation system has the capability of maintaining relative humidity between 30% and 45% at all times, by adding or removing moisture from the air. The operable window in the typical room can open to allow greater ventilation, and instructions for the window operation are provided. These conditions meet the criteria of WELL v2 (IWBI, 2020) T07 and T08 criteria.
60% of pedestrian pathways and building entrances are shaded for more than half of daylight hours each day by awnings. An outdoor seating area and children’s play area are provided near the building. 50% of their area is shaded by tree canopies. These conditions comply with WELL v2 (IWBI, 2020) T09 – Part 1.
The score of B.4.3 is evaluated in Table 90 (corresponding to Excellent performance for this indicator).
Table 90. Example of B.4.3 evaluation.
| Metric | Score |
| Select single value below: | |
| The project does not comply with any of the following WELL v2 (IWBI, 2020) criteria. | x |
| The project complies with the following WELL v2 criteria | √ Check next metrics. |
| WELL v2 criteria (multiple selections allowed): | |
| T01 Thermal performance – Part 1 | +40 |
| T03 Thermal zoning | +15 |
| T05 Radiant thermal comfort | +15 |
| T07 Humidity control | +15 |
| T08 Enhanced operable windows | +15 |
| T09 Outdoor thermal comfort – Part 1 | +15 |
| Indicator score = Σ(metric scores) | 100 |
Source: JRC.
The promotion of physical movement indicator is calculated next, considering the typical 50 m3 room of the building example. As previously mentioned, the room is used as a bedroom and home office. The latter is equipped with a docking station for a laptop, which includes an external keyboard, mouse, adjustable laptop stand and an external monitor. The workstation can be adjusted by the user to work both in a seated and standing position, and the associated workstation chair is also adjustable in height with an adjustable seat pan and backrest angle. Being a home office, the user is not required to stand for 50% or more of their work hours. These design features are provided for all the home office rooms in the building, hence, they meet the WELL v2 criteria for V02 Ergonomic workstation design – Parts 1-4, and V07 Active Furnishings with Tier 2 requirements (IWBI, 2020).
The residential building has a central staircase that is open to all residents of the building and services all occupiable floors. Each apartment door opens onto the stairwell platform. The staircase is decorated with artwork depicting images of nature, and the staircase has a light level of 200 lx. At each floor, signage is located that promotes people to take the stairs rather than the elevator. These design features meet the WELL v2 (IWBI, 2020) criteria for V03 circulation network – Parts 1-3.
The building is located in an urban part of Lisbon, within a 200 m walk distance of an existing cycling network, and an existing bus network that operates frequent trips on weekdays and weekends. All streets within 400 m of the building have continuous raised sidewalks and cycle lanes on both sides of the road, and a vehicular speed limit of 20km/h. Street segments intersect each other every 30m on average. Exterior building walls facing the pedestrian network incorporate windows on the first floor. A bike room is located on the ground floor of the building that can accommodate one bicycle from each flat. The bike room is equipped with a cupboard containing bike maintenance tools that are free for residents to use. Moreover, adjacent to the bike room there is a shower room and changing room with five lockers for use by residents. These design features meet the WELL v2 criteria for V04 Facilities for active occupants – Parts 1-2, and V05 Site planning and selection – Parts 1 and 2 (IWBI, 2020).
Although a children’s playground is provided onsite, a dedicated fitness facility for residents is not provided by the design, and although residents have access to nearby gyms these are at a cost. Hence, the project does not meet criteria WELL v2 V08 Part 1 (but does meet V08 Part 2) and obtains a zero score for this criterion. The building also does not have a multi-purpose room available to residents, and hence does not meet the Fitwel (2020) criterion.
The score for B.4.4 is evaluated in Table 91 (corresponding to Excellent performance for this indicator). Having evaluated the scores for each indicator, B.4 is calculated in Table 92, corresponding to an excellent KPI performance class.
Table 91. Example of B.4.4 evaluation.
| Metric | Score | Non-applicable1 |
| Select single value below: | ||
| The project does not comply with any of the following WELL v2 (IWBI, 2020) criteria (i.e. V02–V08). | x | |
| The project complies with the following WELL v2 criteria (i.e. V02–V08). | √ Check next metrics. | |
| WELL v2 criteria V02–V08 (multiple selections allowed): | ||
| V02 Ergonomic workstation design – Parts 1-4 | +15 | ☐ |
| V03 circulation network2 | +15 | |
| V04 Facilities for active occupants | +15 | |
| V05 Site planning and selection | +15 | |
| V07 Active furnishings with Tier 1 or Tier 2 requirements | +20 | ☐ |
| V08 Physical activity spaces and equipment (both Parts 1 and 2) | 0 | |
| The project also complies with the following criterion: | ||
| Fitwel 8.7 Multi-purpose room (Fitwel 2020) | 0 | |
| Indicator score = Σ(metric scores) | 80 | |
1 If the non-applicable option is selected (when available), the full metric score is considered in the evaluation of the indicator score.
2 Effort should be made to provide stairs as close as possible to the lifts, to reduce separation and provide a similar journey for people using the stairs and people using the lifts. Lifts should be easy to locate with appropriate wayfinding and signage. It should be ensured that any enhanced feature of the stair, such as music, artwork or game, does not create a safety hazard, disturbance or distraction to users who may be negatively impacted.
Source: JRC.
Table 92. Example of B.4 evaluation.
| Indicator | B.4.1 | B.4.2 | B.4.3 | B.4.4 |
| Indicator score | 95 | 77.5 | 100 | 80 |
| Indicator performance class (indicative) | (Excellent)1 | (Good)1 | (Excellent)1 | (Excellent)1 |
| B.4 score | = 0.25 ∙ 95 + 0.25 ∙ 77.5 + 0.25 ∙ 100 + 0.25 ∙ 80 = 88.1 | |||
| B.4 performance class | Excellent | |||
| B.4 performance class score (PCSB.4) | 100 | |||
1 Transformation of the indicator score to an indicator performance class is indicative and not required by the self-assessment method to estimate KPI and dimension scores and performance classes.
Source: JRC.
4.8 Improving accessibility of the built environment for everyone (B.5)
4.8.1 Description and assessment
The Physical Accessibility for Everyone KPI (B.5) evaluate the extent to which the project design provides ease of physical access in terms of three indicators:
- Ease of circulation (B.5.1): extent to which movement of different users through, around and between spaces and environments is enabled without barriers and without compromise to their safety and experience.
- Safe wayfinding (B.5.2): extent to which the design conveys spatial information to users to help them identify and comprehend the various elements within the environment around them.
- Usability and operation (B.5.3): extent to which the design is usable and operable by all users, regardless of their abilities or background.
B.5 score is evaluated according to Equation (139).
(139)
Each indicator is evaluated with a score between 0-100 and a corresponding indicative performance class (indicator class is provided just to guide users but not used further in the evaluation of KPIs and dimensions), according to adherence with best-practice design guidance, and beyond best-practice standards and guidance that are typically voluntary. The performance class of the B.5 key performance indicator is assessed according to the thresholds in Figure 69.
Figure 69. B.5 performance classes and thresholds.

Source: JRC.
The KPI and its indicators are designed to be implemented at all project scales, types and main uses (Table ). The assessment of B.5.1, B.5.2 and B.5.3 is affected by the project scale and type.
When a project, classified into the neighbourhood or urban scale, involves several buildings with distinct design characteristics, thus likely leading to different indicator scores for each of them, the evaluation of the indicators shall be carried out by identifying representative samples of buildings with similar design features. For each of these representative building designs, a separate assessment should be performed. The overall score per indicator is then estimated as a weighted average of the separate assessment scores, with the weights obtained from the relative occurrence of each building design.
For renovation projects, the assessment focuses on the specific aspects of the building and spaces that are affected by the proposed renovation works. However, when indicators and/or metrics address an aspect that has not been altered by the renovation, their evaluation should consider the as-built state (i.e. condition before the intervention is set), as this contributes to the accessibility of the built environment.
The evaluation of the indicators within B.5 is conducted by the design team, comprising architects and service engineers, potentially seeking the advice of product manufacturers, and main and specialist contractors. The assessment requires the following information to be identified and collected:
- Standards, guidelines and certification scheme documents, as well as any national standards relevant to universal design and design for disabilities.
- Information of the project location and relation to roads, pedestrian areas, cycle lanes and public transportation.
- Project design plans, architectural and structural design drawings, service plans.
- Plans for the use of different areas of the project, with identification of regularly occupied individual and multi-occupant spaces.
- Information on the type of users and their needs.
- Characteristics of internal finishes (ceiling, walls, flooring), and manufacturer information regarding the light reflectance value (LRV) of surfaces and finishes.
- Specifications of doors, handles, handrails, toilets, sinks, seating, furniture and other fixings.
- Details on design, specifications and placement of controls and switches.
- Plans and information on the location of signage and its visual and tactile characteristics.
- Information on means of delivery and content of acoustic messaging and cues in the design.
4.8.2 Ease of circulation (B.5.1)
The Ease of circulation indicator (B.5.1) evaluates the extent to which the project design enables the movement of different users through, around and between spaces and environments without barriers and without compromise to their safety and experience. It focuses on evaluation of the adequacy of entrances, horizontal circulation (e.g. across a building floor) and vertical circulation (i.e. access to other floors). As the provision of adequate circulation comprises numerous design elements, the indicator evaluation is based on compliance with best practice standards and beyond best-practice guidance that specifically addresses users with diverse abilities.
The evaluation of the indicator score is summarised in Table 93. The indicator score cannot exceed 100. On some occasions, next to the metrics of the indicator, a “non-applicable” option exists, so that users can indicate that the specific metric is not relevant to the project attributes. If the non-applicable option is selected (when available), the full metric score should be considered in the evaluation of the indicator score, to avoid penalising a project due to non-relevant aspects.
Figure 70 shows indicator thresholds adopted to associate the indicator score to an indicator performance class. While these thresholds and performance classes are not directly applied in the evaluation of KPI and dimension scores and performance classes, they are included here to assist users in determining appropriate performance levels for specific project aspects and to offer clear guidance on their improvement.
EN 17210 (CEN, 2021b) sets out performance objectives for safe physical accessibility for different users in several sections of the standard, covering indoor circulation and access to the project from the exterior. Particular care is given to consider the needs of users with mobility impairments, including those using wheelchairs or walking aids. EN 17210 also promotes consultation with users to identify their needs for physical accessibility.
This standard is considered current best-practice. Hence, non-compliance with this performance standard results in an indicator score of zero. An indicative Acceptable performance class for the indicator is based (at a minimum) on compliance with EN 17210 (CEN, 2021b) using national guidelines. A higher indicator score can be achieved by demonstrating compliance with the EN 17210 performance criteria using the specifications included in TR 17621 (CEN, 2021c) (or alternative national guidance that provides equal or more stringent criteria than TR 17621). Higher indicator scores can also be achieved by implementing enhanced design criteria that have been derived from BS 8300-2 (BSI, 2018; Irish Technical Guidance Document M (DHLGH, 2022), DIN 18040-1 (DIN, 2010) and PAS 6463 (BSI, 2022). The enhanced criteria are grouped into categories according to the area or asset that they relate to in the project design. Each category of enhanced criteria is assigned a maximum score to ensure that an Excellent indicative performance class for B.5.1 cannot be achieved without enhanced design features across the entire project. Accordingly, if either all relevant criteria within a category are satisfied, or all criteria within a category are non-applicable, the maximum score of the category is achieved.
Table 93. B.5.1 score.
| Metric | Score | Non-applicable1 |
| Select single value below: | ||
The project does not comply with the EN 17210 (CEN, 2021b) sections listed below.
| B.5.1 = 0. No further points to be added. | |
| The project complies with the following EN 17210 sections:2 | Check next metrics. | |
| 9.1.1–2, 9.1.4–6, 9.1.10–11, 9.1.13–14 Entrances | ||
| 9.2.1–2, 9.2.4–7 Corridors and passageways | ☐ | |
| 9.3.1–5 Doors | ||
| 9.5.1–3 Patios, balconies and terraces | ☐ | |
| 10.1.1–7,10.1.10, 10.1.12-13 Ramps | ☐ | |
| 10.2.1–5, 10.2.10-12 Steps and stairs | ||
| 10.3.1–3 Handrails | ||
| 10.4.1–4 Lifts | ☐ | |
| 10.5 Vertical and inclined lifting platforms | ☐ | |
| 10.6 Escalators and moving walks | ☐ | |
| 11.1.1–6 Service counters for information, ticketing and reception | ☐ | |
| 11.2.1–3 Waiting and queuing areas | ☐ | |
| Compliance with EN 17210 is demonstrated through (single selection allowed): | ||
| Compliance is demonstrated through use of national guidance and regulations with accessible design criteria that are less stringent than TR 17621 (CEN, 2021c). | +20 | |
| Compliance is demonstrated through use of TR 17621, or national guidance and regulations with equally (or more) stringent accessible design criteria. | +40 | |
| The project also complies with the following enhanced design features (multiple selections allowed but a maximum score applies to each category): | ||
| Category: Entrances and doors | (≤15) | |
| Entrance doors and internal lobby doors have a min clear width of 1.00 m. | +5 | |
| Minimum clear width of internal doors is 0.85 m (including accessible toilets). | +5 | |
| Minimum 0.70 m of clear space is provided at the latch side of the door. | +2.5 | |
| Side-hung gates are self-closing. | +2.5 | ☐ |
| Where there is risk of crowding, alternative entrances and exits are provided with clear signage, or appropriate management procedures. | +5 | ☐ |
| Entrance canopy (if provided) extends beyond the door width for at least 1.25 m to accommodate a wheelchair and provide sufficient space to avoid the direct flow of people using the entrance doors. | +2.5 | ☐ |
| If a large entrance canopy is provided, seating allows a person or people to pause and reset before entering or leaving. Materials used at entrance canopy do not accentuate the sound of rain or similar. | +2.5 | ☐ |
| Category: Corridors, passageways and other spaces | (≤15) | |
| Corridors have a minimum unobstructed width of 1.80 m between handrails or other projections. | +5 | ☐ |
| Minimum turning space of 1.50m · 1.50m is achieved for wheelchair users for a turn of 90 degrees. | +5 | ☐ |
| Long narrow corridors are avoided, or are broken up using windows on side walls, intersections, and recesses, and if dead-end corridors are provided, they incorporate a seating area. | +5 | ☐ |
| Places to pause or break a journey are provided, for example with seating, allowing people to reset and recharge before continuing. | +5 | ☐ |
| Category: Steps and stairs | (≤10) | |
| There are no spiral, helical or curved stairs. | +5 | ☐ |
| There are no skewed stairs or stair winders. | +5 | ☐ |
| Minimum distance of 3.00 m is provided between descending stairs located opposite lift doors and the lift doors. | +5 | ☐ |
| Category: Lifts, vertical and inclined lifting platforms, escalators and moving walks | (≤15) | |
| An alternative to escalators and moving walks is provided. | +5 | ☐ |
| Clear manoeuvring space in front of lift car entrance and inclined lifting platforms is minimum 1.80 m in diameter. | +5 | ☐ |
| Clear width of vertical lifting platform doors at landing is a minimum of 0.90 m. | +5 | ☐ |
| Lift cars do not have black or dark floor finishes. | +2.5 | ☐ |
| A small mirror in a lift is provided to facilitate safe reversing for wheelchair users. A large mirror is avoided as it can be frightening for people with dementia. | +2.5 | ☐ |
| Category: Service counters for information, ticketing and reception | (≤5) | |
| Manoeuvring space in front of service counters is minimum 1.80 m in diameter. | +5 | ☐ |
| Reception/information counters are identifiable from the main point of entry. | +5 | ☐ |
| Indicator score = Σ(metric scores) | ≤ 100 | |
1 If the non-applicable option is selected (when available), the full metric score is considered in the evaluation of the indicator score. If satisfied and non-applicable metrics result in a score higher than the maximum within a category, then the maximum score of the category is applied.
2 If the section of EN 17210 does not apply to the project (i.e. non-applicable is selected), then as long as all other stated sections are complied with, then the project is deemed to be in compliance with EN 17210.
Source: JRC.
Figure 70. B.5.1 indicative performance classes and thresholds.

Source: JRC.
4.8.3 Safe wayfinding (B.5.2)
The Safe wayfinding indicator (B.5.2) evaluates the extent to which the design conveys spatial information to users to help them identify and comprehend the various elements within the environment around them. This includes spatial information to aid orientation and navigation and use of the space without harm or compromise. In particular it looks at whether: (i) sufficient visual contrast is provided to ensure users can easily identify and comprehend the various elements within the environment, (ii) finishes are safe, clear and void of elements or patterns which may create confusion to users, (iii) signage, information and communication systems provide the necessary information for users to navigate and use the space independently and with confidence, including alternative formats for people with specific needs. As numerous design elements need to be considered, evaluation of this indicator is based on the level of design adherence to best practice and beyond best-practice design guidance that specifically addresses users with diverse abilities.
The evaluation of the indicator score is summarised in Table 94. The indicator score cannot exceed 100. On some occasions, next to the metrics of the indicator, a “non-applicable” option exists, so that users can indicate that the specific metric is not relevant to the project attributes. If the non-applicable option is selected (when available), the full metric score should be considered in the evaluation of the indicator score, to avoid penalising a project due to non-relevant aspects. Figure 71 shows indicator thresholds adopted to associate the indicator score to an indicator performance class. While these thresholds and performance classes are not directly applied in the evaluation of KPI and dimension scores and performance classes, they are included here to assist users in determining appropriate performance levels for specific project aspects and to offer clear guidance on their improvement.
EN 17210 (CEN, 2021b) sets out performance objectives for safe wayfinding and orientation for different users in several sections. These mainly cover indoor wayfinding and access to the project from the exterior, as well as clarity of signage and messaging. The EN 17210 standard provides design guidance for users of different ages and with physical impairments (e.g. mobility, auditory and visual impairments), and is considered current best-practice. Hence, non-compliance with this performance standard, results in an indicator score of 0. An Acceptable indicative performance class is based (at a minimum), on compliance with EN 17210 using national guidelines. A higher indicator score can be achieved by demonstrating compliance with the EN 17210 performance criteria using the specifications provided in TR 17621 (CEN, 2021c) (or alternative national guidance that provides equal or more stringent criteria than TR 17621). Higher indicator scores can also be achieved by implementing enhanced design criteria that also account for users with neurodiversity, and which derive from BS 8300-2 (BSI, 2018), ISO 19028 (ISO, 2016), NS 11001-1 (NS, 2018) and PAS 6463 (BSI, 2022). The enhanced criteria are grouped into categories according to the area, asset or design feature that they relate to in the project design. Each category of enhanced criteria is assigned a maximum score to ensure that an Excellent indicative performance for B.5.2 cannot be achieved without enhanced design features across the entire project. Accordingly, if either all relevant criteria within a category are satisfied, or all criteria within a category are not applicable, the maximum score of the category is achieved.
Visual contrast is adopted as one of the wayfinding cues in built environment projects. It is defined as the visual perception between one elements of a building (TR 17621). Visual contrast may be obtained by a combination of luminance contrast and colour contrast. Since people with impaired vision can rely only on luminance contrast, this is used in TR 17621 for visual contrast determination. As stated in Annex A of TR 17621, three main methods can be adopted for the estimation of luminance contrast, i.e. the Michelson contrast formula, the Weber contrast formula, and the light reflectance value (LRV) difference. The three methods are not comparable, and the selected method should be used consistently when adhering to the specifications provided in TR 17621. In the B.5.2 enhanced criteria, the LRV difference is used. LRV is defined as the proportion of visible light reflected by a surface at all wavelengths and directions, when illuminated by a light source. The LRV scale ranges from 0, which is a perfectly absorbing surface that could be assumed to be totally black, up to 100, which is a perfectly reflective surface that may be considered as the perfect white (BSI, 2018). For the selection of colours and materials during a planning procedure, the use of LRV is regarded to be appropriate as LRV values may be provided by the supplier of the colour system or can be measured with samples in a laboratory (see BS 8300-2, BSI, 2018 Annex B). The LRV difference is the point difference between the LRV values of two surfaces. Differences less than 20 points may not give adequate visual contrast, even with an illuminance of 200 lx on the surfaces (BSI, 2018).
Table 94. B.5.2 score.
| Metric | Score | Non-applicable1 |
| Select single value below: | ||
The project does not comply with the EN 17210 (CEN, 2021b) sections listed below.
| B.5.2 = 0. No further points to be added. | |
| The project complies with the following EN 17210 sections:2 | Check next metrics. | |
| 6.1 Wayfinding, orientation and navigation | ||
| 6.2 Wayfinding information | ||
| 6.3.1-3 Wayfinding - visual contrast | ||
| 6.4 Tactile information | ||
| 6.5 Audible information and hearing enhancement | ||
| 6.6 Signage | ||
| 6.7 Graphical symbols | ||
| 9.1.3, 9.1.7, 9.1.9 Entrances | ||
| 9.2.3, 9.2.12–14 Corridors and passageways | ☐ | |
| 9.3.10 Doors | ||
| 9.6 Surface finishes and materials | ||
| 10.3.6–7 Handrails | ||
| 10.4.8 Lifts | ☐ | |
| 11.1.7–8 Service counters for information, ticketing and reception | ☐ | |
| 11.2.4–5 Waiting and queuing areas | ☐ | |
| 11.3.11 Seating and resting areas | ☐ | |
| 13.1 User interface, controls and switches – rationale | ||
| 13.2 Public ICT information screens | ☐ | |
| 13.3 ICT user interfaces | ||
| Compliance with EN 17210 is demonstrated through (single selection allowed): | ||
| Compliance is demonstrated through use of national guidance and regulations with wayfinding design criteria that are less stringent than TR 17621 (CEN, 2021c). | +20 | |
| Compliance is demonstrated through use of TR 17621, or national guidance and regulations with equally (or more) stringent wayfinding design criteria. | +40 | |
| The project also complies with the following enhanced design features (multiple selections allowed but a maximum score applies to each category): | ||
| Category: Tactile information | (≤5) | |
| The maximum size of a tactile map is 0.60 m high · 1.00 m wide. | +5 | |
| The height of the relief of raised tactile letters, figures and graphical symbols is 1.00–1.50 mm. | +5 | |
| Category: Signage and public ICT information screens | (≤15) | |
| Signs are separated from other notices and pictures to avoid a cluster of competing information. | +2.5
| ☐ |
| Signage has both symbols and words (except for universally accepted or mandatory safety symbols or pictures), is concise and easy to interpret, and contrasts from the surface it is mounted on (light reflectance value (LRV) difference ≥ 70). | +5 | ☐ |
| Signage uses consistent terminology in the built environment, digitally, and in any other medium. | +5
| ☐ |
| Directional signage is visible from all directions of approach, where practicable, and repeated at each decision and reassurance point. | +5 | ☐ |
| Location signs confirm arrival at destinations. | +5 | ☐ |
| The position of ICT screens above head height are at a minimum height of 2.30 m. | +5 | ☐ |
| Category: Steps, stairs, lifts, vertical and inclined lifting platforms, escalators and moving walks | (≤10) | |
| Steps and escalators have a strong visual contrast (LRV difference ≥ 70 points) to the edge of the tread and riser. | +5 | ☐ |
| Bold or intense patterns are avoided on walkways or stairs. | +5 | ☐ |
| Category: Wayfinding | (≤15) | |
| Information and wayfinding are provided in at least two sensory formats, including visual, audible, and tactile. | +5
| |
| Opportunities to preview spaces such as through glazing, from outside or within the building, are provided where appropriate. | +5 | |
| Unique and highly visible features are positioned in strategic locations to assist in wayfinding. | +2.5 | |
| In complex visitor destinations, help points are provided at key intervals. | +2.5 | ☐ |
| Key amenities (e.g. WCs, baby change, tea points, first-aid, restorative rooms) are located consistently throughout the building so they are found in a similar position on all floors. | +5 | |
| Category: Colours and patterns | (≤10) | |
| Vivid colours are kept to a minimum (to avoid overwhelm), and if red is used, especially on a white background, it is used sparingly (red causes difficulties for some people). | +5 | |
| Large areas (including floors) of highly contrasting geometric or repetitive patterns (LRV difference ≥ 30 points) and patterns in three dimensional forms (including shadow patterns) are avoided. | +5 | |
| Visual contrast (LRV difference ≥ 15 points) between adjacent floor finishes is avoided, or one or more incremental bands that are ≥ 50mm deep are provided to create a graduated change between the two primary surfaces. | +5 | |
| Category: Information | (≤5) | |
| Pre-visit preview information provides information about the environment, what to expect during a visit, and journey information. Preview information is available before the visit (e.g. virtual flythrough videos, audio description, building plans) as well as upon arrival. | +5 | ☐ |
| If crowds are inevitable at predictable times, these timings are publicised so that people can avoid them, alongside provision of well signposted restorative spaces. | +5 | ☐ |
| Indicator score = Σ(metric scores) | ≤ 100 | |
1 If the non-applicable option is selected (when available), the full metric score is considered in the evaluation of the indicator score. If satisfied and non-applicable metrics result in a score higher than the maximum within a category, then the maximum score of the category is applied.
2 If the section of EN 17210 does not apply to the project (i.e. non-applicable is selected), then as long as all other stated sections are complied with, then the project is deemed to be in compliance with EN 17210.
Source: JRC.
Figure 71. B.5.2 indicative performance classes and thresholds.

Source: JRC.
4.8.4 Usability and operation (B.5.3)
The Usability and operation indicator (B.5.3) evaluates the extent to which the project is usable and operable by all users, regardless of their abilities or background. This indicator focuses on whether the necessary and desired facilities for people with diverse needs available are available, and whether usable and operable elements within the space, such as furnishings, fixtures and fittings, are easy to use and operate by all users.
The evaluation of the indicator score is summarised in Table 95. The indicator score cannot exceed 100. On some occasions, next to the metrics of the indicator, a “non-applicable” option exists, so that users can indicate that the specific metric is not relevant to the project attributes. If the non-applicable option is selected (when available), the full metric score should be considered in the evaluation of the indicator score, to avoid penalising a project due to non-relevant aspects. Figure 72 shows indicator thresholds adopted to associate the indicator score to an indicator performance class. While these thresholds and performance classes are not directly applied in the evaluation of KPI and dimension scores and performance classes, they are included here to assist users in determining appropriate performance levels for specific project aspects and to offer clear guidance on their improvement.
EN 17210 (CEN, 2021b) sets out performance objectives for usability and operation for different users in several sections, and mainly considers the needs of users of different ages and with physical impairments (e.g. mobility, auditory and visual impairments). The EN 17210 standard is considered current best-practice, and similarly to B.5.1 and B.5.2, non-compliance with it, results in an indicator score of 0. An Acceptable indicative performance class is based (at a minimum) on, compliance with EN 17210 using national guidelines. A higher indicator score can be achieved by demonstrating compliance with the EN 17210 performance criteria using the specifications provided in TR 17621 (CEN, 2021c) (or alternative national guidance that provides equal or more stringent criteria than TR 17621). Higher indicator scores can also be achieved by implementing enhanced design criteria that provide enhanced specifications and address users with neurodiversity. These derive from BS 8300-2 (BSI, 2018), ISO 21542 (ISO, 2021), ONORM B 1600 (ASI, 2017), PAS 6463 (BSI, 2022) and WELL v2 (IWBI, 2020). The enhanced criteria are grouped into categories according to the area, asset or design feature that they relate to in the project design. Each category of enhanced criteria is assigned a maximum score. This is done to ensure that an Excellent performance for B.5.3 cannot be achieved without enhanced design features across the entire project. Accordingly, if either all relevant criteria within a category are satisfied, or all criteria within a category are not applicable, the maximum score of the category is achieved.
Table 95. B.5.3 score.
| Metric | Score | Non-applicable1 |
| Select single value below: | ||
| The project does not comply with the EN 17210 (CEN, 2021b) sections listed below. | B.5.3 = 0. No further points to be added. | |
| The project complies with the following EN 17210 sections:2 | Check next metrics. | |
| 9.3.7–8, 9.3.12–14 Doors | ||
| 9.4.1–5 Windows | ||
| 10.3.5 Handrails | ||
| 10.4.5–6, 10.4.12 Lifts | ☐ | |
| 11.2.6 Waiting and queuing areas | ☐ | |
| 11.3.1–10, 11.3.12 Seating and resting areas | ☐ | |
| 11.4 Storage areas, lockers and baggage storage | ☐ | |
| 11.5 Kitchen areas and kitchenettes | ☐ | |
| 11.6 Facilities for assistance dogs | ||
| 12.1.1–7 Accessible toilets | ||
| 12.2 Toilets for general use | ||
| 12.3 Sanitary facilities for other users | ||
| 12.4 Showers and bathrooms | ||
| 13.4 User interface, controls and switches – controls and switches | ||
| 13.5 User interface, controls and switches – examples of general use elements | ||
| Compliance with EN 17210 is demonstrated through (single selection allowed): | ||
| Compliance is demonstrated through use of national guidance and regulations with usability and operation design criteria that are less stringent than TR 17621 (CEN, 2021c). | +20 | |
| Compliance is demonstrated through use of TR 17621, or national guidance and regulations with equally (or more) stringent usability and operation design criteria | +40 | |
| The project also complies with the following enhanced design features (multiple selections allowed but a maximum score applies to each category): | ||
| Category: Doors | (≤10) | |
| Operating force of maximum 15 N for manually operated doors without door closers. | +5 | |
| A horizontal supportive grab bar is provided for doors wider than 0.85 m and for the inside face of accessible toilet doors. | +5 | |
| All manually operated door opening hardware is lever action. | +2.5 | ☐ |
| Category: Lifts | (≤5) | |
| Lift cars have a min of one handrail on each car wall, only interrupted by the operating panel, with the free space between the wall and the gripping part at least 50 mm. | +5 | ☐ |
| Category: Kitchen areas and kitchenettes | (≤5) | |
| Cupboard doors have a 180-degree opening. | +2.5 | ☐ |
| Pull-out shelves in kitchen areas and kitchenettes are fitted immediately below the work surface. | +2.5 | ☐ |
| Refrigerators and freezers are fitted as separate units on a plinth with a min. height of 0.20 m. | +2.5 | ☐ |
| Category: User interface, controls and switches | (≤15) | |
| Where card slots are provided, they are between 0.80-0.90 m above floor. | +2.5 | ☐ |
| Minimum distance from control to internal corners is 0.70 m. | +5 | |
| Height of controls above floor surface is between 0.80 m and 1.10 m. | +5 | |
| Fixtures and controls are low noise where practicable (e.g. soft close cupboards and toilet lids, quiet flush WC systems). Where provided, quiet hand dryers (maximum 70 dB) are selected. | +5 | |
| Fittings, switches, controls and technology are intuitive and simple to use. Additional simple directions for use are provided. | +5 | |
| Category: Facilities | (≤20) | |
| WELL v2 (IWBI, 2020) V04 Facilities for Active occupants – Part 2 criteria are met. | +5 | ☐ |
| WELL v2 (IWBI, 2020) C09 New mother support – Part 2 criteria are met. | +5 | |
| Sanitary facilities (including WCs, changing rooms and showers where provided) are ambulant-accessible, wheelchair-accessible (including wheelchair-accessible for children), and appropriate for use by obese and bariatric users. | +5 | |
| There is provision for self-contained WCs (with sink inside and within reach from the toilet bowl), baby changing facilities (for all genders), and stoma management within WCs. | +5 | |
| First aid/medical facilities and equipment are provided in sufficient quantities for the number of users. | +5 | |
| Category: Restorative spaces | (≤10) | |
| WELL v2 (IWBI, 2020) M07 Restorative spaces criteria are met. | +5 | |
| Space(s) for practice of faith and/or contemplation are provided. | +5 | ☐ |
| Where a large space is provided, smaller areas within the space allow retreat, or variation in ceiling heights is provided, with lower ceiling creating a more intimate quiet space. | +5 | ☐ |
| Category: Furnishings | (≤5) | |
| A mix of furniture styles is used to meet a variety of user needs and settings. This includes ergonomic considerations, including sit-stand desks, and different seat heights and support features, giving people options and choices to find the most suitable solution for their requirements. | +5
| |
| Indicator score = Σ(metric scores) | ≤ 100 | |
1 If the non-applicable option is selected (when available), the full metric score is considered in the evaluation of the indicator score. If satisfied and non-applicable metrics result in a score higher than the maximum within a category, then the maximum score of the category is applied.
2 If the section of EN 17210 does not apply to the project (i.e. non-applicable is selected), then as long as all other stated sections are complied with, then the project is deemed to be in compliance with EN 17210.
Source: JRC.
Figure 72. B.5.3 indicative performance classes and thresholds.

Source: JRC.
4.8.5 Example (B.5)
In this example a renovation project type for non-residential main use is considered. The assessment is carried out at the building scale. A textile factory, built in the 1800s, is sited in Lyon, France. Once at the outskirts of the city, with increasing urban development, it is now sited in a mixed-use area that combines residential and light commercial properties. A two-storey building, part of the textile factory complex, is renovated and transformed into a community facility for performing arts. The building provides the case study for the B.5 evaluation example (Figure 73). The community facility will be used by schools, community groups and charities. The latter includes a charity that promotes performing arts in adults with intellectual limitations or learning disabilities, many with co-occurring physical, visual and hearing impairments.
On the ground floor, the renovation includes three new studio spaces, each with a specific use: creative workshop studio, dance studio and full theatre rehearsal studio. These branch out from a central community meeting space and a café. The studios form three sides of the central space. The fourth side includes at its centre the main entrance and lobby with a reception desk, two accessible toilets and a stair and lift for accessing the second floor. Female and male changing rooms (containing showers and further toilets) are on both sides of the lobby. The second floor of the building includes two storage rooms, office space with two accessible toilets and a technical studio and sound booth that serves the theatre rehearsal studio. To enhance ease of use, corridors are avoided throughout the renovated building.
Figure 73. Fictitious community centre plans.
Ground floor: |
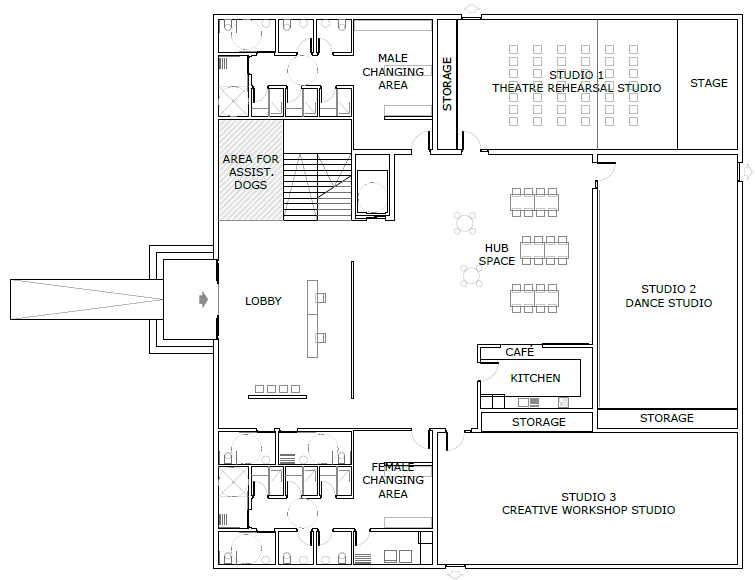 |
First floor: |
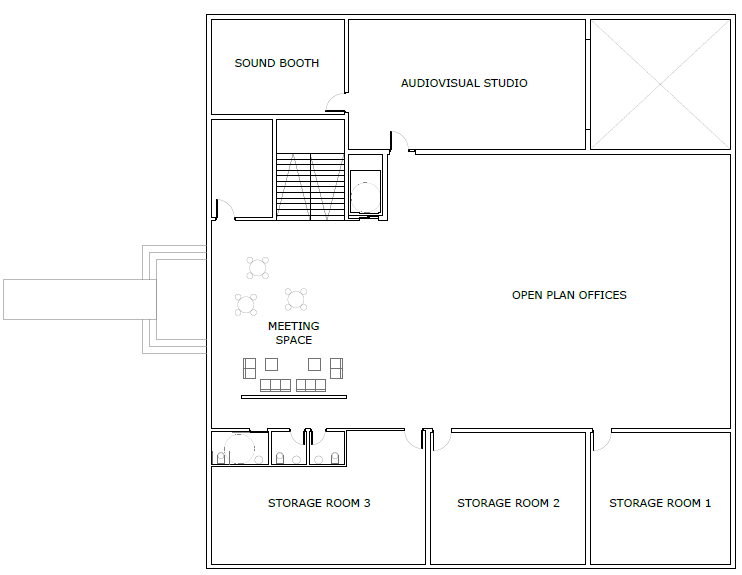 |
Source: JRC.
Ease of circulation (B.5.1) is evaluated according to the metrics of Table 93.
Access, entrances and doors: Most users access the studios by public transportation. Others use door-to-door paratransit service and arrive at a drop-off zone, just beyond the building entrance. A public road runs in parallel to the façade, and is one of the few that intersects the complex of green space and multi-block textile factory buildings. Access from street level to the main entrance is provided via three steps, as well as by a ramp, which leads onto a landing. The landing is 2.50 m wide and 4.00 m in length, exceeding the minimum dimensions needed for wheelchair manoeuvring (CEN, 2021c, section 9.15(b)). The landing is fully covered by a canopy that cantilevers out from the building, providing headroom of 2.20 m. The landing is at the same level with the entrance and main lobby, whereas gratings are provided on the landing in front of the main entrance doors to prevent dirt being brought in. The main entrance comprises automatic sliding doors with a stop mechanism, opearated via a movement sensor or manually by pressing a clearly visible button that is mounted on a post. The sliding doors provide a clear width of 1.50 m and clear height of 2.00 m. A silver-coloured intercom system is provided on the wall at the side of the door at a height of 0.90 m above floor level. An emergency exit is provided in each of the three studios, and each exit provide direct step-free access to the streets, surrounding the building. Emergency exit devices are operated by a horizontal bar. All internal doors (e.g. to the changing rooms, offices, accessible toilets) are 1.00 m wide, except for the internal doors to the studio, which are 1.80 m wide double doors. No risk of crowding is identified. The entrance and door features meet the requirements of EN 17210 (CEN, 2021b) with the specifications of TR 17621 (CEN, 2021c). Enhanced criteria for the entrance doors, internal doors and canopy size are met, but not for the canopy seating area. The enhanced criterion for an automated door is met. As there are no side-hung gates, the related enhanced criterion does not apply.
Corridors, passageways and other spaces: To enhance ease of use, corridors are avoided in the renovation design. An open space of 2.00 m · 2.00 m is provided in front of the lift for wheelchair manoeuvring. The building is composed of large open spaces in general (i.e. studios and central community meeting area), with most furniture either being on castors (with brakes) or light enough to be re-arranged freely. The central community meeting area and café provide a place of rest in transition between the lobby and studios. The corridors, passageways and other spaces meet the requirements of EN 17210 with the specifications of TR 17621. Enhanced criteria for the minimum turning spaces, avoidance of corridors and spaces of rest are met. The enhanced criterion of minimum unobstructed width of corridor does not apply.
Patios, balconies and terraces: There are none in the case study.
Ramps, steps and stairs: The only ramp in the project is a straight ramp that provides access from street level to the landing in front of the main entrance. The ramp rise is 0.45 m with a gradient of 1:17 (5.9%) and length of 7.66 m. The ramp clear width is 1.5 m, allows frequent two-way traffic (permitting a walking person and a wheelchair user to pass each other). Two handrails are provided, which extend 0.30 m beyond the end of the ramp at both ends. The ramp is equipped with an upstand at each side of height 0.15 m. A flight of steps (3 steps) is provided in addition to the ramp. These steps have a rise of 0.15 m and a going of 0.30m. An internal staircase exists between the ground and first floor of the building. This is sited adjacent to the lift and has a half turn intermediate landing of 1.70 m depth, located 10 steps up from the ground floor. The internal staircase has an unobstructed width of 1.50 m and surface width of 1.70 m (allowing for handrails), which is adequate for evacuation use. Handrails are provided that are continuous across the stairs and landing, and extend 0.30m horizontally beyond the first and last step of each flight of stairs. The ramps, steps and stairs meet the requirements of EN 17210 considering the specifications of TR 17621. Enhanced criteria for avoiding curved and skewed stairs are met. The enhanced criterion regarding siting of stairs opposite to lifts does not apply, as the stairs are located adjacent to the lift.
Lifts, vertical and inclined lifting platforms, escalators and moving walks: There are no vertical or inclined lifting platforms, escalators or moving walks in the project. A lift is provided to facilitate access between the ground and first storey of the building. The lift has a size of 1.50 m · 2.10 m, which can accommodate one wheelchair and one additional passenger, allowing wheelchair rotation within the car. The lift is large enough to allow use with a stretcher in case of emergency. The lift is not equipped with a small mirror. As previously stated, an open space of 2.00 m · 2.00 m is provided in front of the lift for wheelchair manoeuvring. The lift meets the requirements of EN 17210 considering the specifications of TR 17621. The lift does not meet the enhanced criterion of provision of small mirror in the lift for wheelchair manoeuvring, but it does meet the enhanced criterion for space in front of the lift. The lift meets the enhanced criteria for colour.
Service counters for information, ticketing and reception, waiting and queuing areas: The reception desk, which is 0.80 m high, is directly in front of the main entrance. An open space of 2.50 m · 4.00 m (depth by width) is provided in front of the reception desk and a seating for 4 people is provided adjacent to the entrance. A 0.70 m clear height and 0.30 m recess is provided under the reception desk, at the front, to allow approach from people in wheelchairs. The reception and waiting areas meet the requirements of EN 17210 considering the specifications of TR 17621, and meet both the relevant enhance criteria.
B.5.1 score is in Table 96 (corresponding to Excellent performance for this indicator).
Table 96. Example of B.5.1 evaluation.
| Metric | Score | Non-applicable1 |
| Select single value below: | ||
The project does not comply with the EN 17210 (CEN, 2021b) sections listed below.
| x | |
| The project complies with the following EN 17210 sections:2 | √ Check next metrics. | |
| 9.1.1–2, 9.1.4–6, 9.1.10–11, 9.1.13–14 Entrances | ||
| 9.2.1–2, 9.2.4–7 Corridors and passageways | ☒ | |
| 9.3.1–5 Doors | ||
| 9.5.1–3 Patios, balconies and terraces | ☒ | |
| 10.1.1–7,10.1.10, 10.1.12-13 Ramps | ☐ | |
| 10.2.1–5, 10.2.10-12 Steps and stairs | ||
| 10.3.1–3 Handrails | ||
| 10.4.1–4 Lifts | ☐ | |
| 10.5 Vertical and inclined lifting platforms | ☒ | |
| 10.6 Escalators and moving walks | ☒ | |
| 11.1.1–6 Service counters for information, ticketing and reception | ☐ | |
| 11.2.1–3 Waiting and queuing areas | ☐ | |
| Compliance with EN 17210 is demonstrated through (single selection allowed): | ||
| Compliance is demonstrated through use of national guidance and regulations with accessible design criteria that are less stringent than TR 17621 (CEN, 2021c). | 0 | |
| Compliance is demonstrated through use of TR 17621, or national guidance and regulations with equally (or more) stringent accessible design criteria. | +40 | |
| The project also complies with the following enhanced design features (multiple selections allowed but a maximum score applies to each category): | ||
| Category: Entrances and doors | (≤15) category max score applies | |
| Entrance doors and internal lobby doors have a min clear width of 1.00 m. | +5 | |
| Minimum clear width of internal doors is 0.85 m (including accessible toilets). | +5 | |
| Minimum 0.70 m of clear space is provided at the latch side of the door. | +2.5 | |
| Side-hung gates are self-closing. | +2.5 | ☒ |
| Where there is risk of crowding, alternative entrances and exits are provided with clear signage, or appropriate management procedures. | +5 | ☒ |
| Entrance canopy (if provided) extends beyond the door width for at least 1.25 m to accommodate a wheelchair and provide sufficient space to avoid the direct flow of people using the entrance doors. | +2.5 | ☐ |
| If a large entrance canopy is provided, seating allows a person or people to pause and reset before entering or leaving. Materials used at entrance canopy do not accentuate the sound of rain or similar. | +2.5 | ☐ |
| Category: Corridors, passageways and other spaces | (≤15) category max score applies | |
| Corridors have a minimum unobstructed width of 1.80 m between handrails or other projections. | +5 | ☒ |
| Minimum turning space of 1.50m · 1.50m is achieved for wheelchair users for a turn of 90 degrees. | +5 | ☐ |
| Long narrow corridors are avoided, or are broken up using windows on side walls, intersections, and recesses, and if dead-end corridors are provided, they incorporate a seating area. | +5 | ☒ |
| Places to pause or break a journey are provided, for example with seating, allowing people to reset and recharge before continuing. | +5 | ☐ |
| Category: Steps and stairs | (≤10) category max score applies | |
| There are no spiral, helical or curved stairs. | +5 | ☐ |
| There are no skewed stairs or stair winders. | +5 | ☐ |
| Minimum distance of 3.00 m is provided between descending stairs located opposite lift doors and the lift doors. | +5 | ☒ |
| Category: Lifts, vertical and inclined lifting platforms, escalators and moving walks | (≤15) category max score applies | |
| An alternative to escalators and moving walks is provided. | +5 | ☒ |
| Clear manoeuvring space in front of lift car entrance and inclined lifting platforms is minimum 1.80 m in diameter. | +5 | ☐ |
| Clear width of vertical lifting platform doors at landing is a minimum of 0.90 m. | +5 | ☒ |
| Lift cars do not have black or dark floor finishes. | +2.5 | ☐ |
| A small mirror in a lift is provided to facilitate safe reversing for wheelchair users. A large mirror is avoided as it can be frightening for people with dementia. | 0 | ☐ |
| Category: Service counters for information, ticketing and reception | (≤5) category max score applies | |
| Manoeuvring space in front of service counters is minimum 1.80 m in diameter. | +5 | ☐ |
| Reception/information counters are identifiable from the main point of entry. | +5 | ☐ |
| Indicator score = Σ(metric scores) | 100 | |
1 If the non-applicable option is selected (when available), the full metric score is considered in the evaluation of the indicator score. If satisfied and non-applicable metrics result in a score higher than the maximum within a category, then the maximum score of the category is applied.
2 If the section of EN 17210 does not apply to the project (i.e. non-applicable is selected), then as long as all other stated sections are complied with, then the project is deemed to be in compliance with EN 17210.
Source: JRC.
Safe wayfinding (B.5.2) is evaluated according to the metrics of Table 94.
In the community centre for performing arts, safety information includes signage for hazardous areas (including stairs), accessible evacuation routes and fire extinguishers. These are placed at 1.50 m and 2.20 m heights to allow them to be read and seen at a distance, respectively. They are located away from other signage to avoid confusion and have an LRV difference of 60 with respect to surrounding background. Information concerning fire safety and evacuation procedures is provided at all entrances and final emergency exits. Approaches to the entrance ramp and steps from above and below are highlighted with a coloured strip of width equal to 0.10 m that provides a visual contrast with the landing and ramp surfaces (LRV difference of 60 points). At the internal staircase, a visually contrasting line with a width of 0.04 m is provided on the front edge of the going in each step with LRV 80 points, which extends across the width of the step. The LRV value for the step surface is 20 points, thus the LRV difference is 60 points and lies within the accepted range for hazard zones in figure A.3 in TR 17621. All handrails are coloured to have an LRV difference of 30 with respect to the adjacent wall. The handrails are provided with raised Braille script at locations along their length that indicates the direction of fire evacuation. Tactile walking surface indicators (TWSI) with attention patterns (based on ISO 23599, ISO, 2019), and with profile heights of 4mm, rounded edges and LRV differences of 50 points with respect to surrounding surfaces, are used on the landings at the top and bottom of the outdoor steps and ramp. TWSI with similar specifications are also used at the top bottom of each flight of stairs indoors. These TWSI extend the full width of the stairs (and ramp), are set back 0.30 m from the hazard and extend 0.60 m in the perpendicular direction. The café kitchen, a potentially hazardous area, is set behind a door and accessible by a programmed lock system.
Information for wayfinding includes signage in the reception area that indicates the location of the stairs and lift, changing rooms, toilets, and throughway to the community meeting area and studios, as well as directional signage from the central community meeting area to the studios. Signs are designed for maximum readability; therefore, font, text size, spacing, and alignment are chosen based on their ability to communicate messages clearly and directly. Standard and recognisable symbols, icons and pictograms are used along with text and braille. A consistent terminology is used in all signage, and other visual, acoustic and tactile messaging. The height of the relief of raised tactile letters, figures and graphical symbols is 1 mm. Appropriate lighting is provided for readability of signs. The specifications of TR 17621 sections 6.6 and 6.7 are met. Signs stating arrival at a point of interest are provided. A tactile map 0.5 m high by 0.5 m wide is provided at the reception area on a stand which angles the map at 20 degrees to the horizontal. Audible and visual information is provided through accessible public ICT screens in the reception area and central community meeting space, placed at 1.60 m height. No public ICT screens are placed at higher height. A hearing enhancement system is installed in each of the performance studios.
Important wayfinding features in the project are highlighted through visual contrast complemented by acoustic or tactile cues. Moderate visual contrast is provided between large surface areas (floor, walls and ceilings), with LRV difference between adjoining large surfaces being in the range of 30 to 40 points throughout the building, which meets the TR 17621 requirement of LRV difference equal to or higher than 30 points for large surfaces. The entrance to the building is easily identifiable due to the large canopy. Moreover, the sliding doors of the entrance are transparent and have a white frame (LRV = 83 points) that visually contrasts against the exterior brick (LRV = 30 points) façade of the building (LRV difference = 53 points). The doors have horizontal contrasting markings on the glazing that highlight its presence and indicate where the door opens. Smaller items that enable the use of building elements, such as the intercom at the front entrance and door handles, have an LRV difference equal to or higher than 70 points with respect to adjoining surfaces. A grating is located on the landing in front of main entrance doors. The grating has a length of 2.00 m and slots with mesh width 0.01 m and mesh length 0.02 m. The grating slots are flush with the floor, well drained and run across in the direction of travel, hence they contribute to acoustic orientation. Tactile cues to navigate the space include building textures, which identify the old versus new components of the building and allow users to familiarise themselves with the material representing each area. The central community meeting space walls where the entrances to Studios 1 and 2 are located, are made of brick and dry wall, respectively, with the entry to Studio 3 located to one side of the café kitchen. Internal doors leading to the studios strongly contrast with the surrounding wall in colour and material.
All floor surfaces are level and flat without irregularities exceeding 5 mm, and made of firm materials that have adequate load-bearing capacity for persons using wheeled mobility devices. Both walls and floors have low reflective properties and are void of patterns. Vivid colours and bold patterns are avoided throughout the project. The stairs are located so that they are not in the direct line of travel. The location of accessible toilets is the same on both floors of the building. Opportunities to preview spaces are provided. The entrance doorway is glazed. All internal doors, except for those leading to toilets and changing rooms, include glazed panels (extending from 0.60 m to 1.70 m above floor level and 0.15 m wide), in order for users to verify whether they intend to enter the space beyond, especially during rehearsals and classes. The lift is glass-encased to support visual orientation.
The project has a website that provides information about how to get to the building, the internal plan and environment, facilities and provides a virtual tour via a video. Crowding is avoided via bookings.
B.5.2 score is evaluated for the building in Table 97 (corresponding to Excellent performance). Overall, the project meets the specifications of EN 17210 through compliance with TR 17621 requirements. The project meets most of the B.5.2 enhanced criteria. It does not meet the criteria for: signage LRV difference equal to or higher than 70 points, directional signage to be visible from all directions, height of public ICT screens, steps having 70 points LRV difference to the edge of the tread and riser. The project is not a complex visitor destination and is not expected to have crowding. These enhanced criteria are therefore not applicable.
Table 97. Example of B.5.2 evaluation.
| Metric | Score | Non-applicable1 |
| Select single value below: | ||
The project does not comply with the EN 17210 (CEN, 2021b) sections listed below.
| x | |
| The project complies with the following EN 17210 sections:2 | √ Check next metrics. | |
| 6.1 Wayfinding, orientation and navigation | ||
| 6.2 Wayfinding information | ||
| 6.3.1-3 Wayfinding - visual contrast | ||
| 6.4 Tactile information | ||
| 6.5 Audible information and hearing enhancement | ||
| 6.6 Signage | ||
| 6.7 Graphical symbols | ||
| 9.1.3, 9.1.7, 9.1.9 Entrances | ||
| 9.2.3, 9.2.12–14 Corridors and passageways | ☐ | |
| 9.3.10 Doors | ||
| 9.6 Surface finishes and materials | ||
| 10.3.6–7 Handrails | ||
| 10.4.8 Lifts | ☐ | |
| 11.1.7–8 Service counters for information, ticketing and reception | ☐ | |
| 11.2.4–5 Waiting and queuing areas | ☐ | |
| 11.3.11 Seating and resting areas | ☐ | |
| 13.1 User interface, controls and switches – rationale | ||
| 13.2 Public ICT information screens | ☐ | |
| 13.3 ICT user interfaces | ||
| Compliance with EN 17210 is demonstrated through (single selection allowed): | ||
| Compliance is demonstrated through use of national guidance and regulations with wayfinding design criteria that are less stringent than TR 17621 (CEN, 2021c). | 0 | |
| Compliance is demonstrated through use of TR 17621, or national guidance and regulations with equally (or more) stringent wayfinding design criteria. | +40 | |
| The project also complies with the following enhanced design features (multiple selections allowed but a maximum score applies to each category): | ||
| Category: Tactile information | (≤5) category max score applies | |
| The maximum size of a tactile map is 0.60 m high · 1.00 m wide. | +5 | |
| The height of the relief of raised tactile letters, figures and graphical symbols is 1.00–1.50 mm. | +5 | |
| Category: Signage and public ICT information screens | (≤15) satisfied | |
| Signs are separated from other notices and pictures to avoid a cluster of competing information. | +2.5
| ☐ |
| Signage has both symbols and words (except for universally accepted or mandatory safety symbols or pictures), is concise and easy to interpret, and contrasts from the surface it is mounted on (light reflectance value (LRV) difference ≥ 70). | 0 | ☐ |
| Signage uses consistent terminology in the built environment, digitally, and in any other medium. | +5
| ☐ |
| Directional signage is visible from all directions of approach, where practicable, and repeated at each decision and reassurance point. | 0 | ☐ |
| Location signs confirm arrival at destinations. | +5 | ☐ |
| The position of ICT screens above head height are at a minimum height of 2.30 m. | 0 | ☐ |
| Category: Steps, stairs, lifts, vertical and inclined lifting platforms, escalators and moving walks | (≤10) satisfied | |
| Steps and escalators have a strong visual contrast (LRV difference ≥ 70 points) to the edge of the tread and riser. | 0 | ☐ |
| Bold or intense patterns are avoided on walkways or stairs. | +5 | ☐ |
| Category: Wayfinding | (≤15) category max score applies | |
| Information and wayfinding are provided in at least two sensory formats, including visual, audible, and tactile. | +5
| |
| Opportunities to preview spaces such as through glazing, from outside or within the building, are provided where appropriate. | +5 | |
| Unique and highly visible features are positioned in strategic locations to assist in wayfinding. | +2.5 | |
| In complex visitor destinations, help points are provided at key intervals. | +2.5 | ☒ |
| Key amenities (e.g. WCs, baby change, tea points, first-aid, restorative rooms) are located consistently throughout the building so they are found in a similar position on all floors. | +5 | |
| Category: Colours and patterns | (≤10) category max score applies | |
| Vivid colours are kept to a minimum (to avoid overwhelm), and if red is used, especially on a white background, it is used sparingly (red causes difficulties for some people). | +5 | |
| Large areas (including floors) of highly contrasting geometric or repetitive patterns (LRV difference ≥ 30 points) and patterns in three dimensional forms (including shadow patterns) are avoided. | +5 | |
| Visual contrast (LRV difference ≥ 15 points) between adjacent floor finishes is avoided, or one or more incremental bands that are ≥ 50mm deep are provided to create a graduated change between the two primary surfaces. | +5 | |
| Category: Information | (≤5) category max score applies | |
| Pre-visit preview information provides information about the environment, what to expect during a visit, and journey information. Preview information is available before the visit (e.g. virtual flythrough videos, audio description, building plans) as well as upon arrival. | +5 | ☐ |
| If crowds are inevitable at predictable times, these timings are publicised so that people can avoid them, alongside provision of well signposted restorative spaces. | +5 | ☒ |
| Indicator score = Σ(metric scores) | 92.5 | |
1 If the non-applicable option is selected (when available), the full metric score is considered in the evaluation of the indicator score. If satisfied and non-applicable metrics result in a score higher than the maximum within a category, then the maximum score of the category is applied.
2 If the section of EN 17210 does not apply to the project (i.e. non-applicable is selected), then as long as all other stated sections are complied with, then the project is deemed to be in compliance with EN 17210.
Source: JRC.
Usability and operation (B.5.3) is evaluated according to the metrics of Table 95.
Doors: The main entrance doors have an automatic opening mechanism, triggered by movement or by the pressing of a button. Internal doors have horizontal handles of ‘D-lever’ type, that are 20 mm in diameter, 80 mm long, and located at a height of 0.90 m from the floor and 30mm from the door edge. The inside faces of accessible toilet doors are equipped with horizontal grab bars. All internal doors, including those for WC and changing rooms have a maximum opening force of 20 N and include kick plates. All internal doors are self-closing and have 0.40 m height at the base of the push side of doors. Emergency exit doors are operated by a horizontal bar.
Windows: The position of the windows in the building is dictated by the original building design. The lower edge of all windows is 1.10 m from the floor, and they extend to 0.50 m from the ceiling height. In the renovation, the location of windows is considered in the space planning, and openable windows are provided at the ground floor in the 3 studios and in the reception area on either side of the main entrance. The pattern of windows is repeated on the first floor, and openable windows are available in the office space, storage rooms and technical studio. No windows are positioned in toilets, the café and central meeting area, changing rooms or stairwell. The windows are equipped with lever handles for manual opening and closing. Moreover, they can be opened through an automated system, with controls for each window placed at 1.00 m height adjacent to the windows and always at a distance more than 0.70 m from any corner.
Ramps, stairs and lifts: Two powder coated metal handrails are provided along the ramp providing access to the main entrance: one at a height of 0.60 m and the second at 0.90 m from the ramp surface. Similarly, nylon-sleeved steel tube handrails are provided at 0.60 m and 0.90 m above the pitch of the stair and surface of landing for the internal staircase. For both the ramp and staircase, the upper and lower handrails have circular profiles with a diameter of 40 mm and 30mm, respectively. Circular handrails with a diameter of 30 mm are provided at a height of 0.90 m, on two sides of the lift car. A tip-up seat is not provided in the car. Both the landing and car control devices are placed at a height of 0.90 m from the floor level and at a distance of 0.50 m away from any corner. Audio messages are provided in the car to inform users of floor level reached, door opening, and at landing to inform of car arrival. All audible messaging is reproduced via an induction loop system. The area of active part of push buttons in both landing and car is 500mm2. Each push button has a diameter of 20 mm and operating force of 2.5 N. Visual contrast is provided between the push buttons, face plate and surroundings. Symbols are provided in relief and braille as an independent feature to tactile figures.
Furnishings: The seating area in the reception comprises 4 fixed seats with the following features: seat height of 0.42 m, seat depth of 0.40m, backrest height of 0.75 m from the floor and angled 100 degrees to the seat, armrests provided every two seats that are at a height of 0.25 m with no setback from the seat front. The edges of the seat, backrest and armrests are rounded. Along one side of the seats, there is a designated space for wheelchair users to stop. Along the other side of the seats there is a free area for assistance dogs. The number of seats in the reception area are deemed adequate for the space use, considering minimal queuing. Furniture in the central community meeting area comprises a range of seat sizes, heights and shapes, adequate for different users. The seats are lightweight and easy to move. Coffee tables are on castors (with brakes) and can be re-arranged freely. Seats in the office space have adjustable heights, inclinations and armrests. All desks have adjustable heights to allow use whilst seated or standing. Accessible lockers are provided in the changing rooms, but hand dryers and WC flushing system are normal and not low-noise ones. Power outlets are provided throughout the building, and mounted on walls at a height of 0.40 m. Drinking fountains are located in the community central meeting space at 0.70 m above floor level and use a lever-type tap system. Wall-mounted first-aid kits are also provided in the three studios, the reception area and office area. All staff is trained in first-aid administration.
Kitchen area and storage: The arrangement of the kitchen in the café considers users with wheelchairs. The kitchen is u-shaped, with work surfaces and appliances located on three sides, and a clear central space of 1.80m in diameter. A 0.60 m wide and a 1.50 m long clear space of counter (void of appliances or base units) with knee recess is provided. This is adjacent to the main kitchen appliances which have features to facilitate access by users on wheelchairs; for example, the refrigerator and freezer are fitted as separate units on a plinth of height of 0.20 m. Knee space is also provided directly below the hob and sink. The sink is shallow and has a lever-type tap and the hob is insulated below. A smooth transition is provided between the work surface, hob and drainer. Kitchen cupboard doors have a 90-degree opening. The storage rooms on the first floor allow access of wheelchairs.
Facilities for assistance dogs: Assistance dogs are welcomed in the building. A gated area, for them to stay when their owner uses the studios, is provided within the community meeting space, in a corner away from the café and visible by staff.
Fire extinguishers and alarms: Fire extinguishers and alarms are located in each large space/room in the building (i.e. reception area, community meeting area, studio rooms, office space). Fire extinguishers are mounted at a height of 0.80 m from the floor and are at least 0.60 m away from any corner. Fire alarms are placed near the fire extinguishers, at a height of 1.00 m from the floor level.
Sanitary accommodation: These are provided adjacent to the reception areas and in the changing room at the ground floor. Other (non-accessible) toilet facilities are also provided in the changing room. On the first floor, the plan location of the accessible toilets is the same as for the ground floor. All accessible toilets have 1.00 m width outward opening doors, with D-lever type door handle that also activates the locking mechanism (when pulled upwards), and horizontal pull handle. One of the accessible toilets in the lobby area is designated as a baby changing facility (and hence are larger, to accommodate a 0.50 m by 0.70 m foldable table, nappy bins and other accessories). Each accessible toilet is a corner-type toilet, with a clear manoeuvring space of at least 1.50 m in front of the toilet pan, and lateral, oblique and frontal space for transfer to toilet pan. The accessible toilets have a toilet seat height of 0.45 m and foldable grab rails at 0.65 m height from the floor (i.e. 0.20 m above the toilet seat level). These extend to 0.20 m in front of the toilet pan, have rounded edges and are able to withstand a force of 1.7 kN in any direction. The accessible toilets have a washbasin located at 0.55 m distance from the toilet seat. The washbasin provides a knee space height of 0.70 m above the floor surface and a knee depth of 0.30 m. The child accessible toilets have a toilet seat height of 0.32 m and foldable grab rails at 0.47 m height from the floor. These extend to 0.20 m in front of the toilet pan, have rounded edges and are able to withstand a force of 1.70 kN in any direction. All washbasins have lever-type tap controls. Separate changing room spaces are provided for male and female users, with a breast-feeding room located in the female changing room. The breast-feeding room contains a comfortable chair, one electrical outlet, a microwave for sterilisation, and a user-operated lock with occupancy indicator. The male and female changing rooms have a shower section. Each shower room section contains four separate showers, one of which is accessible. Eight showers are more than sufficient for a building maximum occupancy of 400 people according to WELL v2 (IWBI, 2020) V04 – Part 2. The accessible showers contain a foldable waterproof shower seat able to withstand a force of 1.70 kN in any direction, with fixed vertical and horizontal grab rails for transfer to seat, and clear manoeuvring space of 1.80 m in diameter. A space of 0.90 m width by 1.30 m depth is also provided alongside the seat.
All design features of the case study project meet the relevant specifications in TR 17621 but do not meet some of the enhanced criteria of B.5.3. The criteria for door opening force and for horizontal bars on wide doors are not achieved. In the latter case, although horizontal grab bars are provided in toilets, they are not on all internal doors (which all exceed 0.85 m in width). The enhanced criterion for handrails in lift cars is not met, nor are the criteria for the kitchen to have 180 degree opening cupboard doors and slide out shelves below the work surface. Minimum distance from control to internal corners is 0.60 m and not 0.70 m. Although all provided controls and switches are intuitive, no additional information is provided for their use. A space for practice of faith and/or contemplation is not provided. Sufficient shower facilities are provided to meet the requirements of WELL v2 (IWBI, 2020) C04 – Part 2. Although a separate breast-feeding room is provided, not all the amenities required by WELL v2 (IWBI, 2020) C09 to be within the breast-feeding room are provided. Hence, this metric is not satisfied. Although the central community meeting space provides an area for distraction and restoration, it only meets 4 of the 5 criteria in Part 1c of WELL v2 (IWBI, 2020) M07. Also, no restorative external space is provided. Hence, the project does not meet this enhanced requirement. The community centre is composed of large spaces but no specific smaller space for retreat is provided within any of these.
B.5.3 score is evaluated in Table 98 (corresponding to Good for this indicator). Addressing any of the design features that do not meet the enhanced criteria, as described above, could increase the score such that it would reach a higher performance class.
Table 98. Example of B.5.3 evaluation.
| Metric | Score | Non-applicable1 |
| Select single value below: | ||
| The project does not comply with the EN 17210 (CEN, 2021b) sections listed below. | x | |
| The project complies with the following EN 17210 sections:2 | √ Check next metrics. | |
| 9.3.7–8, 9.3.12–14 Doors | ||
| 9.4.1–5 Windows | ||
| 10.3.5 Handrails | ||
| 10.4.5–6, 10.4.12 Lifts | ☐ | |
| 11.2.6 Waiting and queuing areas | ☐ | |
| 11.3.1–10, 11.3.12 Seating and resting areas | ☐ | |
| 11.4 Storage areas, lockers and baggage storage | ☐ | |
| 11.5 Kitchen areas and kitchenettes | ☐ | |
| 11.6 Facilities for assistance dogs | ||
| 12.1.1–7 Accessible toilets | ||
| 12.2 Toilets for general use | ||
| 12.3 Sanitary facilities for other users | ||
| 12.4 Showers and bathrooms | ||
| 13.4 User interface, controls and switches – controls and switches | ||
| 13.5 User interface, controls and switches – examples of general use elements | ||
| Compliance with EN 17210 is demonstrated through (single selection allowed): | ||
| Compliance is demonstrated through use of national guidance and regulations with usability and operation design criteria that are less stringent than TR 17621 (CEN, 2021c). | 0 | |
| Compliance is demonstrated through use of TR 17621, or national guidance and regulations with equally (or more) stringent usability and operation design criteria | +40 | |
| The project also complies with the following enhanced design features (multiple selections allowed but a maximum score applies to each category): | ||
| Category: Doors | (≤10) satisfied | |
| Operating force of maximum 15 N for manually operated doors without door closers. | 0 | |
| A horizontal supportive grab bar is provided for doors wider than 0.85 m and for the inside face of accessible toilet doors. | 0 | |
| All manually operated door opening hardware is lever action. | +2.5 | ☐ |
| Category: Lifts | (≤5) satisfied | |
| Lift cars have a min of one handrail on each car wall, only interrupted by the operating panel, with the free space between the wall and the gripping part at least 50 mm. | 0 | ☐ |
| Category: Kitchen areas and kitchenettes | (≤5) satisfied | |
| Cupboard doors have a 180-degree opening. | 0 | ☐ |
| Pull-out shelves in kitchen areas and kitchenettes are fitted immediately below the work surface. | 0 | ☐ |
| Refrigerators and freezers are fitted as separate units on a plinth with a min. height of 0.20 m. | +2.5 | ☐ |
| Category: User interface, controls and switches | (≤15) satisfied | |
| Where card slots are provided, they are between 0.80-0.90 m above floor. | +2.5 | ☒ |
| Minimum distance from control to internal corners is 0.70 m. | 0 | |
| Height of controls above floor surface is between 0.80 m and 1.10 m. | +5 | |
| Fixtures and controls are low noise where practicable (e.g. soft close cupboards and toilet lids, quiet flush WC systems). Where provided, quiet hand dryers (maximum 70 dB) are selected. | 0 | |
| Fittings, switches, controls and technology are intuitive and simple to use. Additional simple directions for use are provided. | 0 | |
| Category: Facilities | (≤20) satisfied | |
| WELL v2 (IWBI, 2020) V04 Facilities for Active occupants – Part 2 criteria are met. | +5 | ☐ |
| WELL v2 (IWBI, 2020) C09 New mother support – Part 2 criteria are met. | 0 | |
| Sanitary facilities (including WCs, changing rooms and showers where provided) are ambulant-accessible, wheelchair-accessible (including wheelchair-accessible for children), and appropriate for use by obese and bariatric users. | +5 | |
| There is provision for self-contained WCs (with sink inside and within reach from the toilet bowl), baby changing facilities (for all genders), and stoma management within WCs. | +5 | |
| First aid/medical facilities and equipment are provided in sufficient quantities for the number of users. | +5 | |
| Category: Restorative spaces | (≤10) satisfied | |
| WELL v2 (IWBI, 2020) M07 Restorative spaces criteria are met. | 0 | |
| Space(s) for practice of faith and/or contemplation are provided. | 0 | ☐ |
| Where a large space is provided, smaller areas within the space allow retreat, or variation in ceiling heights is provided, with lower ceiling creating a more intimate quiet space. | 0 | ☐ |
| Category: Furnishings | (≤5) satisfied | |
| A mix of furniture styles is used to meet a variety of user needs and settings. This includes ergonomic considerations, including sit-stand desks, and different seat heights and support features, giving people options and choices to find the most suitable solution for their requirements. | +5
| |
| Indicator score = Σ(metric scores) | 77.5 | |
1 If the non-applicable option is selected (when available), the full metric score is considered in the evaluation of the indicator score. If satisfied and non-applicable metrics result in a score higher than the maximum within a category, then the maximum score of the category is applied.
2 If the section of EN 17210 does not apply to the project (i.e. non-applicable is selected), then as long as all other stated sections are complied with, then the project is deemed to be in compliance with EN 17210.
Source: JRC.
Having evaluated the scores for each indicator, B.5 is calculated in Table 99, corresponding to an Excellent KPI performance class.
Table 99. Example of B.5 evaluation.
| Indicator | B.5.1 | B.5.2 | B.5.3 |
| Indicator score | 100 | 92.5 | 77.5 |
| Indicator performance class (indicative | (Excellent)1 | (Excellent)1 | (Good)1 |
| B.5 score | = 0.33 · (100 + 92.5) + 0.34 · 77.5 = 89.9 | ||
| B.5 performance class | Excellent | ||
| B.5. performance class score (PCSB.5) | 100 | ||
1 Transformation of the indicator score to an indicator performance class is indicative and not required by the self-assessment method to estimate KPI and dimension scores and performance classes.
Source: JRC.
4.9 Maximising durability and service life (B.6)
4.9.1 Description and assessment
Under the KPI Maximising durability and service life (B.6), a quantitative assessment of the following indicators is provided:
- Durability (B.6.1): Duration of the useful life of the main elements of the building, between necessary refurbishments or renewals.
- Design for adaptability (B.6.2): Extent to which the design of the building allows and accommodates changing user needs and market conditions.
- Design for deconstruction (B.6.3): Extent to which the design of the building facilitates the future disassembly, reuse and recycling of building elements, components, parts and materials.
B.6 score is evaluated according to Equation (140).
(140)
In the above equation, indicators promote resource efficiency, by ensuring that the service life of elements, components, parts and materials is maximised (B.6.1) and likely extended beyond the useful life of the building (B.6.3) that, at the same time, is renewed, allowing accommodating substantial changes in user requirements and needs (B.6.2). The combined optimisation of these three indicators is essential, as poor performance of one indicator may undermine the efforts to maximise the others. Very durable products that are not easily adaptable to new uses and purposes could go out of fashion or become obsolete, due to user needs or market factors, leading to their disuse before the end of their service life. Similarly, durable products that are not designed for disassembly cannot be adequately reused in new buildings or efficiently recycled. Both scenarios result in unnecessary removal, disposal, new purchase and new construction, making an inefficient use of the energy invested into the long-lasting products.
Each indicator is evaluated with a score between 0-100. The performance class of the B.6 key performance indicator is assessed according to the thresholds in Figure 74.
Figure 74. B.6 performance classes and thresholds.

Source: JRC.
B.6 and its three indicators are designed to be implemented at the building scale, aggregating the assessment conducted over main spatial, architectural, structural, installation and service design features (B.6.1 and B.6.2) or its complete bill of quantities (BoQ) and materials (BoM) (B.6.3). To make and manage a harmonised estimate and classification of BoQ and BoM during the design stage, the Level(s) inventory template may be adopted (Donatello et al., 2021). B.6.1, B.6.2 and B.6.3 evaluation is affected by the project scale and type.
When a project, classified into the neighbourhood or urban scale, involves buildings with distinct design characteristics, thus likely leading to different indicator scores for each of them, the evaluation shall be carried out by identifying representative samples of buildings with similar design features. For each of these representative building designs, a separate assessment should be performed. The overall score per indicator is then estimated as a weighted average of the separate assessment scores, with the weights obtained from the relative occurrence of each building design.
For renovation projects, the assessment of B.6.1 and B.6.2 focuses on the specific aspects of the building and spaces that are affected by the proposed renovation works. However, when these indicators and/or any of their metrics address an aspect that has not been altered by the renovation, they are assessed considering the as-built state (i.e. condition existing before renovation and still present in the building), as this determines the service life of the building and its elements. The evaluation of B.6.3, instead, should be focused on the complete BoQ and BoM of the elements, components, parts and materials added during the renovation works.
The evaluation of the indicators is conducted by the design team, comprising architects, structural engineers and service engineers, likely seeking the advice of product manufacturers (B.6.1 and B.6.3), property market experts (B.6.2), demolition contractors and waste management experts (B.6.3), energy/sustainability consultants to conduct a life cycle analysis (LCA) or a global-warming potential (GWP) assessment, or experts familiar with the concept of buildings as material banks (BAMB) (Dodd et al., 2021c, d).
The assessment requires the identification and collection of the building design plans, architectural and structural design drawings, service plans, BoQ and BoM for the whole building or the renovated section of the building.
4.9.2 Durability (B.6.1)
The Durability indicator is evaluated through a dimensionless score. In the absence of a European standardised method, an approach based on the CASBEE property appraisal framework (IBEC, 2014) is adopted in the NEB self-assessment method. B.6.1 measures the capability of the building to maximise the interval between refurbishments and renewals. The durability score varies between 0 and 100 and is calculated as the weighted sum of the scores for the expected service life of main building elements including structural materials, interior and exterior finishes, specific building systems (HVAC, water supply and drainage pipe), and major equipment and services. Equal weights are adopted. The scores for the considered building components are reported in Table 100, and are assigned according to the following rationale:
- Low service life of elements – metric score = 0.
- Acceptable service life of elements – metric score = 33.
- Good service life of elements – metric score = 67.
- Excellent service life of elements – metric score = 100.
Table 100. B.6.1 score.
| Metric | Score | Weight (w) |
| Service life of structural materials (single selection allowed): | ||
< 20 years 20 – < 40 years 40 – < 70 years ≥ 70 years | 0 33 67 100 | 0.2 |
| Service life of exterior finishes (single selection allowed): | ||
< 10 years 10 – < 20 years 20 – < 30 years ≥ 30 years | 0 33 67 100 | 0.2 |
| If [non-residential project type] has been selected, service life of interior finishes (single selection allowed): | ||
< 5 years 5 – < 10 years 10 – < 20 years ≥ 20 years | 0 33 67 100 | 0.2 |
| If [residential project type] has been selected, service life of interior finishes (single selection allowed): | ||
< 10 years 10 – < 15 years 15 – < 25 years ≥ 25 years | 0 33 67 100 | 0.2 |
| Select single value below: | ||
Heating, ventilation, and air conditioning (HVAC) system is present. HVAC system is not present. | Check next metrics. Check next metrics. | |
| If [HVAC systems is present], service life of HVAC, water supply and drainage pipe systems (single selection allowed): | ||
None of the following. Top three most used pipe system types (in terms of weight) > 20 years. At least two out of the top three most used pipe system types (in terms of weight) > 30 years. At least two out of the top three most used pipe system types (in terms of weight) > 40 years and none < 20 years. | 0 33
| 0.2 |
| If [HVAC systems is not present], service life of water supply and drainage pipe systems (single selection allowed): | ||
None of the following. Top two most used pipe system types (in terms of weight) > 20 years. At least one out of the top two most used pipe system types (in terms of weight) > 30 years. At least one out of the top two most used pipe system types (in terms of weight) > 40 years and none < 20 years. | 0 33
| 0.2 |
| Service life of major equipment and services (single selection allowed): | ||
< 7 years 7 – < 15 years 15 – < 30 years > 30 years | 0 33 67 100 | 0.2 |
| Indicator score = Σ(metric score · weight) | ≤ 100 | |
Source: JRC.
Whenever more types of structural materials are present and/or the structural elements face different exposure conditions, the evaluation should be based on the element with shortest service life among those with a share higher than 25% of the total amount of structural materials (either in terms of area or cost). The same applies to internal and external finishes.
For HVAC, water supply and drainage, the assessment focuses on the three pipe system types with the largest total weight of pipes in the building. Each type is characterised by a specific use (i.e. hot, cooling, mixed water, air, oil, etc.), material and jointing method. When pipes are used for water supply and drainage only, with no HVAC system present, the assessment focuses on the two most used pipe system types.
Finally, major equipment and services refer to systems that ensure operationality and liveability in buildings (i.e. generators, boilers, chillers, air conditioners, water tanks, pumps, etc.). The assessment should focus on the devices most extensively used for each main service equipment, based on the number of units and equipment capacity. The final score corresponds to the device with the lowest service life and a cost higher than 25% of the total cost of major equipment and services.
The service life of the main building elements, to be compared against the thresholds of Table 100, shall be determined according to well-established sources and methods such as the factor methodology, defined in ISO 15686-8 (ISO, 2008), accounting for the anticipated building life cycle and the specific operational and environmental conditions of each assessed element that are expected to alter the deterioration rate during its lifespan (IBEC, 2014). Reference service lifespan values are reported by relevant sources such as the Level(s) indicator 1.2 (Dodd et al., 2021b) and the Appendix 1 of the CASBEE manual (IBEC, 2014). The estimation can be supported by specific standards and codes, such as the EN 15459-1 (CEN, 2017) for heating systems, and information provided by manufacturers and suppliers (Dodd et al., 2021b).
Figure 75 shows indicator thresholds adopted to associate the indicator score to an indicator performance class. While these thresholds and performance classes are not directly applied in the evaluation of KPI and dimension scores and performance classes, they are included here to assist users in determining appropriate performance levels for specific project aspects and to offer clear guidance on their improvement.
Figure 75. B.6.1 indicative performance classes and thresholds.

Source: JRC.
4.9.3 Design for adaptability (B.6.2)
The design for adaptability and renovation indicator is evaluated through a dimensionless score based on Level(s) indicator 2.3 (Dodd et al., 2021c). The indicator measures the readiness of a building for adaptation to substantial changes, induced in the medium to long term by demographics, social, economic, technological and physical surrounding conditions (ISO, 2020), such as demand in the property market, existing and future user needs and life changes (Dodd et al., 2021c). The aim is to ensure adequate load capacity and space to accommodate the new functions (IBEC, 2014). The adaptability score varies between 0 and 100 and is the sum of the weighted scores for each adaptability aspect incorporated into the building design (Dodd et al., 2021c). The scores and the aspects that are targeted by B.6.2 are reported in Table 101, where the metric scores are assigned according to the following rationale:
- Changing building use and equipment is extremely difficult – metric score = 0.
- Changing building use and equipment is moderately difficult – metric score = 1.
- Changing building use and equipment is relatively easy – metric score = 2.
- Changing building use and equipment is extremely easy – metric score = 3.
Most of the scores and weights reported in Table 101 were originally proposed for the design of office buildings. In the absence of a standardised alternative method, the values are considered in the NEB self-assessment method as applicable to both residential and non-residential (commercial) buildings. Regarding the ‘higher ceilings for service routes’ aspect, the specific metric score values included in Table 101 for residential buildings are based on values recommended by the building flexibility calculator and the adaptive capacity calculation tool, provided by BREEAM Netherlands (Dutch Green Building Council, 2023). The same sources are used to implement minor amendments to the original Level(s) indicator 2.3 table (Dodd et al., 2021c).
Table 101. B.6.2 score.
| Metric | Score | Weight (w) |
| Changes to the internal space distribution: | ||
| Column grid spans: Minimum spacing of vertical load-bearing elements (single selection allowed): | ||
< 5400 mm 5400 – < 8100 mm ≥ 8100 mm free span | 0 33 67 100 | 0.04 |
| Façade pattern: Spacing between openings (single selection allowed): | ||
≥ 1800 mm 1350 – < 1800 mm 1350 – < 1800 mm, some openings 900 – < 1350 mm 900 – < 1350 mm, some openings < 900 mm | 0 33 67 100 | 0.04 |
| Internal wall system (single selection allowed): | ||
Immovable interior walls, multiple functions (more than 20% of the walls in linear metres are load bearing). Immovable interior walls, non-permanent (non-load bearing). Movable interior walls, require disassembly. Easily movable interior walls, partition system. | 0 33 67 100 | 0.14 |
| Unit size and access: Average portion of floor area that can be used separately from other spaces (single selection allowed): | ||
≥ 600 m2 400 – < 600 m2 200 – < 400 m2 < 200 m2 | 0 33 67 100 | 0.10 |
| Changes to the building services: | ||
| Ease of access to service ducts: Location of key service ducts (single selection allowed): | ||
Embedded in the floor. Between 2 building layers. Above one building layer (floor), exposed or easily removable cover. Below one building layer (ceiling), exposed or easily removable cover. | 0 33 67 100 | 0.04 |
| Ease of access to plantrooms (single selection allowed): | ||
Embedded in a sub-basement of the building. Located on the roof or within an accessible patio. Located on the ground floor with easy external access. Located external to the building with complete access. | 0 33 67 100 | 0.04 |
| Longitudinal ducts for service routes (single selection allowed): | ||
Connection grid in 1 direction Cable duct in 1 direction Connection grid in 2 directions Cable duct in 2 directions | 0 33 67 100 | 0.04 |
| Higher ceilings for service routes: If [non-residential project type] has been selected, internal height (floor surface to structural surface for at least 95% of the floor area) (single selection allowed): | ||
< 3000 mm 3000 – < 3500 mm 3500 – < 4000 mm ≥ 4000 mm | 0 33 67 100 | 0.14 |
| Higher ceilings for service routes: If [residential project type] has been selected, internal height (floor surface to structural surface for at least 95% of the floor area) (single selection allowed): | ||
< 2600 mm 2600 – < 3000 mm 3000 – < 3400 mm ≥ 3400 mm | 0 33 67 100 | 0.14 |
| Services to sub-divisions: Average portion of floor area that can be serviced by a sanitary facility (single selection allowed): | ||
≥ 600 m2 400 – < 600 m2 200 – < 400 m2 < 200 m2 | 0 33 67 100 | 0.10 |
| Changes to the building façade and structure: | ||
| Façades (single selection allowed): | ||
Bearing façade with bearing obstacles1 Bearing façade, no bearing obstacles1 Non-bearing façade with bearing obstacles1 Non-bearing facade, no bearing obstacles1 | 0 33 67 100 | 0.14 |
| Futureproofing of load bearing capacity of floors: Imposed loads (at least for 75% of the floor area): (single selection allowed): | ||
2.00 kN/m2 3.00 kN/m2 4.00 kN/m2 5.00 kN/m2 | 0 33 67 100 | 0.14 |
| Structural design to support future expansion: Capacity to add storeys (single selection allowed): | ||
1 storey 2 storeys 3 storeys 4 or more storeys | 0 33 67 100 | 0.04 |
| Indicator score = Σ(metric score · weight) | ≤ 100 | |
1 Examples of obstacles include bearing interior walls, columns, elevator shafts or installation ducts.
Source: Adapted from Dodd et al. (2021c) and (Dutch Green Building Council (2023).
The adaptability of the building project to accommodate variations in demands and uses is evaluated across three main categories of design concepts: (i) internal space distribution; (ii) building servicing; (iii) building façade and structure.
The organisation of internal space influences the flexibility for reconfiguring interiors as the needs of users change. Vertical load bearing elements and non-structural walls may limit the viable layouts and uses. In particular, greater spacing between vertical load-bearing elements allows for an open-plan design, providing maximum flexibility for reconfiguring spaces. Similarly, walls designed to be demountable or movable, without affecting the structural integrity or interfering with service ducts, can significantly increase the adaptability, as they can easily accommodate new layouts. If more than 20% of the walls (in linear metres) are load bearing, walls should be considered as ‘immovable and multiple functions’. Non-permanent walls are non-load bearing. Walls are movable if they can be placed in another location without material losses and fulfilling the same functions (W/E Adviseurs and Dutch Green Building Council, n.d.). Narrower façade bays contribute by creating smaller, more manageable sections of the façade, which can be more easily modified or replaced independently of the rest of the building, and by supporting the rearrangement of rooms number, sizes and functions. Multiple access points enhance adaptability by allowing different areas to be used independently or in various configurations. This is particularly important for buildings that may be subdivided or repurposed. This aspect is evaluated through the average area of the units, namely portions of the floor area with their own entrance and whose space can be used separately from the others (W/E Adviseurs and Dutch Green Building Council, n.d.).
Regarding adaptability aspects relevant to service ducts, the assessment should focus on system parts which support and provide the main functions required for each building use, namely the main parts of air conditioning pipes, the main sections of the building plumbing and wiring system, and the main sections of the building communication cables.
The ease of replacing and reorganising service and equipment is a critical aspect of adaptability in building design. It is essential to position key service ducts in locations that are accessible without causing damage to surrounding building components. Placing them above or below elements such as false ceilings or raised floors or in exposed areas facilitates maintenance, upgrade, or replacement operations with respect to embedded solutions. However, false ceilings and raised floors that are closed and non-accessible for inspections require intrusive operations to allow replacement and reorganisation of the service, including demolition and reconstruction, potentially damaging the surrounding elements. In this case the ducts are considered as located between two building layers and a limited improvement to adaptability is obtained. Ducts in exposed areas or covered by easily removable floors and ceilings (e.g., suspended tiles and metal framework, or lamellar ceilings) allow higher adaptability. Additionally, having greater internal height in a building to accommodate service routes further enhance adaptability. In the assessment this is calculated as the clear height from the top of the finished floor surface to the bottom of the lowest structural section. The maximum value representative of at least 95% of the floor area should be considered (W/E Adviseurs and Dutch Green Building Council, n.d.). Similarly, the location and accessibility of plantrooms are crucial for streamlining alterations to mechanical and electrical equipment. Longitudinal ducts for service routes, facilitating the distribution from central sources to different building areas, offer more flexibility in the placement of service points compared to connection grids in which connections are at fixed locations. This longitudinal ducts or connection grid can be distributed along a single direction, i.e. within a wall. However, the flexibility further benefits from distributions occurring in two directions. Regarding sanitary facilities, accommodating future subdivisions is facilitated by having a larger number of individual servicing points. This aspect is evaluated by considering the average portion of floor area served by each sanitary facility.
Ultimately, adaptability is significantly impacted by the structural capacity of load-bearing elements. On one hand, any proposed new use or alteration to the horizontal or vertical layout is constrained by the structure ability to support increased loads. In particular, structural floor systems must present an adequate load bearing capacity, at least for 75% of the total floor area, for anticipated changes in live loads, due to repurposing. Whereas actual load-bearing elements must support future additions of storeys. On the other hand, the presence of load-bearing elements within or interacting with the façade restricts the permissible alterations and reorganisations of both internal room subdivisions and external façade patterns.
Figure 76 shows indicator thresholds adopted to associate the indicator score to an indicator performance class. While these thresholds and performance classes are not directly applied in the evaluation of KPI and dimension scores and performance classes, they are included here to assist users in determining appropriate performance levels for specific project aspects and to offer clear guidance on their improvement.
Figure 76. B.6.2 indicative performance classes and thresholds.

Source: JRC.
4.9.4 Design for deconstruction (B.6.3)
The Design for deconstruction indicator is quantitatively evaluated through a dimensionless score originally developed as Level(s) indicator 2.4 (Dodd et al., 2021d). The indicator varies between 0 and 100, for increasing ease of disassembly and extent of reuse, and may be weighted by mass, by volume or by value of the applicable elements (components, parts and materials). Mass is considered as a convenient common unit to compare distinct building elements, as it is expected to be easily estimated even when these products are supplied in units other than mass. To prevent an excessive influence of heavier products on the final score, the overall score may be weighted by volume or by economic value. In this case, cost should be specific to the building elements (components, parts and materials), excluding any labour or installation (Dodd et al., 2021d).
The spreadsheet calculator of the Level(s) indicator 2.4 may be used to identify the relevant building elements (Table 102). Subsequently, for each element the respective mass, volume or economic value should be estimated.
Table 102. Taxonomy of building elements.
| Tier 1 | Tier 2 | Tier 3 (building elements) | Tier 4 (components, parts, materials) |
| Shell | Foundations (substructure) | Piles and shallow foundations | For piles: e.g. load-bearing piles, end-bearing piles, friction piles, pile caps and ground anchors. For shallow foundations: e.g., strip, trench-fill, rubble trench or raft foundations |
| Basements | e.g. waterproofing, masonry blocks, precast concrete modules, reinforced concrete, insulation. | ||
| Retaining walls | e.g. sheet piles or diaphragm walls. | ||
| Loadbearing structural frame | Frame (beams, columns and slabs) | e.g. all loadbearing elements appearing in the superstructure (above ground structure). | |
| Upper floors | e.g. coverings on floors, including screeds, damp-proof courses, insulating and protective layers, wearing surfaces, false floors for services and floating floors. | ||
| External walls | e.g. components used for building the wall, whether it is loadbearing or non-loadbearing. Also covers parapets, infillings, protective treatments, insulation and connections to other building elements. | ||
| Balconies | e.g. balcony wall, glazing, privacy screens etc. | ||
| Non-load bearing elements | Ground floor slab | e.g. reinforcement, concrete, connections to structural columns, surface treatments for waterproofing. | |
| Internal walls, partitions and doors | e.g. infills, precast wall units, window frames, windows, door frames, doors, locking mechanisms, toilet cubicles or partitions and any plaster rendering, cladding, sealing, insulation or protective layers. | ||
| Stairs and ramps | e.g. structural material plus any physical support rails for users and connections. | ||
| Façades | External wall systems, cladding and shading devices | e.g. external cladding, including renders, damp-proofing, insulation and protective layers. | |
| Façade openings (including windows and external doors) | e.g. lintels, window frames, door frames, windows, doors, locking mechanisms, shutters, window sills, fittings and ventilation components. | ||
| External paints, coatings and renders | |||
| Roof | Structure | e.g. standard structural elements such as wall plates, rafters, joists, gable walls, purlins, trusses, connectors, any connected overhanging canopies, roof slab, blue roofs (designed to hold rainwater on roof); green roofs (designed for vegetation). | |
| Weatherproofing | e.g. roof coverings such as plain tiles, interlocking tiles, slates, insulation, sealing and waterproofing treatments. | ||
| Parking facilities | Above ground and underground (within the curtilage of the building and servicing the building users) | e.g. flooring, surface treatments, floor/wall markings, access barriers etc. | |
| Core | Fittings and furnishings | Sanitary fittings | e.g. sanitaryware such as WC bowls, cisterns, urinals, bidets, washbasins, sinks, showers, bathtubs. |
| Cupboards, wardrobes and worktops (where provided in residential property) | (Mostly relevant to residential buildings) e.g. cupboard units, wardrobes, worktops, handles, panels, shelves and sealants. | ||
| Ceilings | e.g. ceiling lining, including plaster rendering, insulation, protective layers or acoustic materials associated with tightly-attached or suspended ceilings. | ||
| Wall and ceiling finishes | e.g. paints, varnishes or plaster rendering. | ||
| Floor coverings and finishes | e.g. covering materials and associated underlays, damp-proof courses, insulation, grout, binders and coatings applied to floating floor or raised floor surfaces. Skirting boards at wall edges is also included here. | ||
| In-built lighting system | Light fittings | e.g. fixed lights or lighting units comprising one or more lamps and associated control gear (not including the light switch and wiring to the lighting unit). | |
| Control systems and sensors | e.g. building automation and control for aspects such as CO2 concentration controlling ventilation equipment for maintaining indoor air quality or temperature controlling heating/cooling system for maintaining thermal comfort. | ||
| Energy system | Heating plant and distribution | e.g. boilers, heat pumps, (combined heat and power plants are counted under “electricity generation”) heat exchangers, connectors, radiators and distribution piping and ductwork. | |
| Cooling plant and distribution | e.g. air conditioning units, fans, reversible heat pumps, dehumidification equipment, connectors and ductwork. | ||
| Electricity generation and distribution | e.g. photovoltaic, wind turbines or combined heat and power plant for onsite generation. Also including cabling from the local substation to the building junction box and cabling and switchgear, safety devices and circuits throughout the building to each plug socket. | ||
| Ventilation system | Air handling units | e.g. equipment dedicated to mechanical ventilation, including ductwork. Any units responsible for heat recovery in ventilated air should be counted under heating plant and distribution. | |
| Ductwork and distribution | e.g. ductwork and distribution for heating plant, cooling plant and mechanical or passive ventilation. | ||
| Sanitary systems | Cold water distribution | Piping, connections and fittings from the mains water inlet to sanitary devices throughout the building. Includes any equipment and parts for the collection, storage and distribution of collected rainwater or greywater. | |
| Hot water distribution | e.g. piping, connections and fittings that transfer hot water from heating plant to sanitary devices (hot water taps and shower). | ||
| Water treatment systems | e.g. first flush diverters for collected rainwater or filters for collected greywater and rainwater. | ||
| Building drainage system | e.g. pipes, fittings and storage tanks for the drainage of greywater or blackwater from sanitary devices, roof guttering and drainage and drainage from impermeable ground on the plot. | ||
| Other systems | Lifts and escalators | e.g. motors, escalator handrails, lift compartment, interior lift cladding, escalator side panelling etc. | |
| Firefighting installations | e.g. sprinkler piping network, water tank, spray units, booster pumps etc. | ||
| Communication and security installations | e.g. closed circuit TV network, cameras, data recording and storage devices, alarm systems, cabling and sensors. | ||
| Telecoms and data installations | e.g. cabling, wi-fi routers, servers and ancillary equipment for and onsite data centres. | ||
| External works | Utilities | Connections and diversions | e.g. to mains water line, to local sub-station for electricity supply etc. |
| Substations and equipment | e.g. control panels, fuses, transformers, trip switches and possible. | ||
| Landscaping | Paving and other hard surfacing | e.g. tiles, flagstones, blocks and kerbstones made of natural stone, fired clay or precast concrete. | |
| Fencing, railings and walls | e.g. iron grated railings, fencing posts, brick walls, plastic coated metal wire fencing etc. | ||
| Drainage system | e.g. to mains sewerage network or alternative drainage routes via sustainable drainage infrastructure installed onsite and possibly near site as well. |
Source: Dodd et al. (2021d).
For each building element (components, parts and materials), the best practical outcome at the end-of-life (i.e. disposal, recovery, recycle, reuse) must be identified. B.6.3 score is calculated as the ratio of the actual quantity of deconstructed elements (Qdec) to their total quantity (Qtotal), measured by mass (kg), volume (m3) or by economic value (Euro).
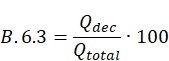
(141)
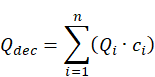
(142)
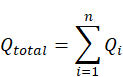
(143)
Qi and ci are the quantity and the circularity coefficient of the i-th product, respectively, out of the n forming the whole building. The circularity coefficient varies from 0 to 1, depending on the outcomes defined in the hierarchy of the Directive on waste (Directive, 2008; Dodd et al., 2021d), presented in Figure 77. The circularity coefficients associated with the outcomes are provided in Table 103.
B.6.3 score can be further broken down to scores corresponding to specific elements, as a means to identify weak building elements in terms of deconstruction.
Figure 77. Logic process for the assignment of circularity coefficient and waste hierarchy.
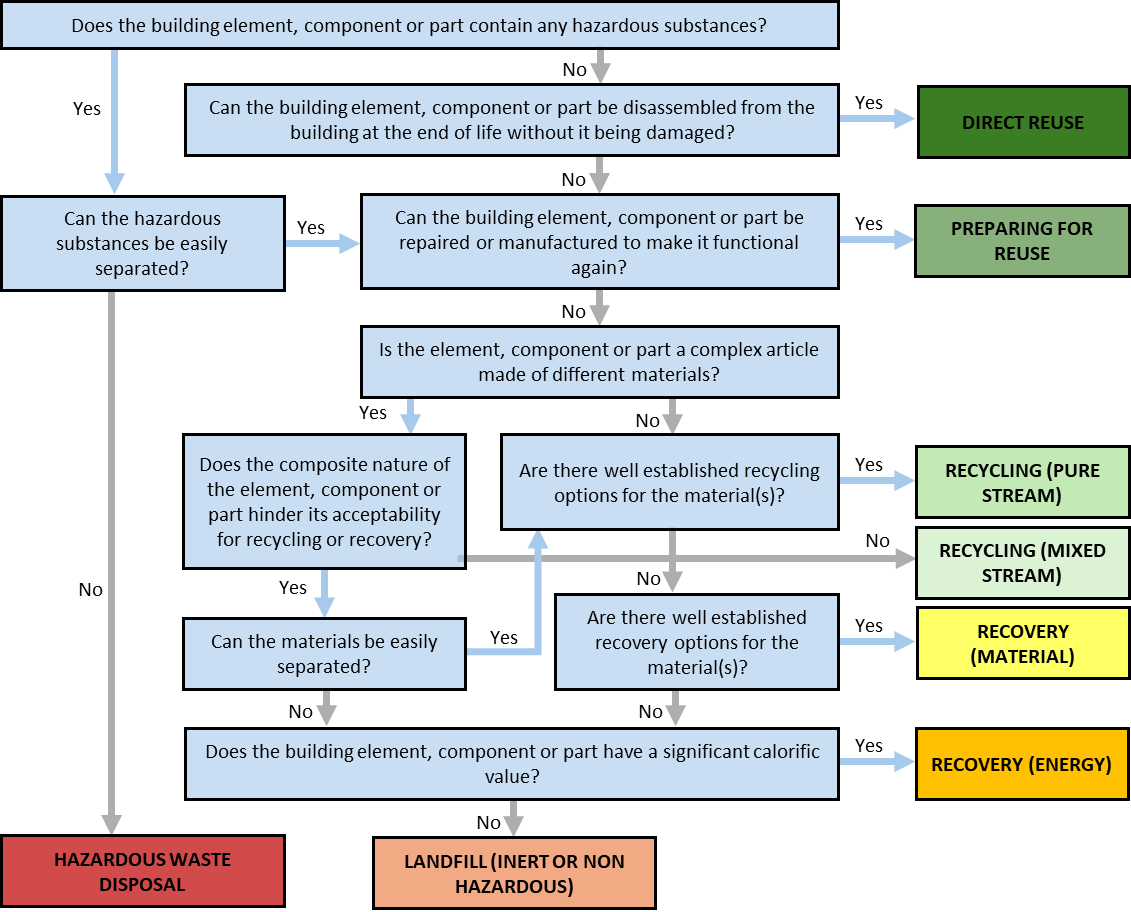
Source: Dodd et al. (2021d).
Table 103. Circularity coefficient.
| Waste hierarchy | Hazardous waste disposal | Inert or non-hazardous landfill | Energy recovery | Material recovery | Mixed stream recycling | Pure stream recycling | Preparing for reuse | Direct reuse |
| Circularity coefficient (ci) | 0.00 | 0.01 | 0.15 | 0.25 | 0.50 | 0.75 | 0.90 | 1.00 |
Source: Dodd et al. (2021d).
Recommended performance thresholds for B.6.3 indicator and the minimum percentage of materials that should be directed to a specific end-of-life outcome are found in international and national standards and well-established certification schemes. Although a B.6.3 score equal to 100 is potentially achievable especially for buildings with limited service life, requiring full reusability is often impractical as some components may be obsolete by the time of the deconstruction (ISO, 2020). According to the European Directive on waste (Directive, 2008), at least 70% (by weight) of the non-hazardous construction and demolition waste (excluding naturally occurring material) generated on the construction site shall be prepared for reuse, recycling and other material recovery.
Design for deconstruction has been adopted by the Italian Minimum Environmental Criteria (CAM), made mandatory by the ‘Procurement Code’ (Decree, 2023). CAM includes an award for tenderers that adopt services designed to be fully disassembled, reused and/or recycled at the end-of-life (Decree, 2022). The Italian sustainability rating system, ITACA protocol, and the related UNI/PdR 13 (UNI, 2019) standard defines four increasing levels of performance in terms of design of disassembly with thresholds equal to 50, 65 and 80% in weight of shell elements (i.e. load-bearing and non-load-bearing elements, façades, and roof) designed to ensure ease of disassembly for reuse or recycle. Recently, the assessment method has been updated to UNI (2023). The LEED v4 certification scheme (USGBC, 2019) sets two increasing levels. The lower requires 50% of the total construction and demolition material diverted away from disposal towards higher outcomes of the waste hierarchy, including at least three material streams (such as concrete, wood, metal, plastic or glass), including complete cycles of collection, sorting and reprocessing into new products. The higher requires 75% of material diverted including at least four material streams. Another example is the Vancouver Green Demolition by-law (Council of the City of Vancouver, 2023), which requires that any authorised demolition of a residential building constructed in whole or in part before 1950 should result in the reuse or recycling of not less than 75–90% (in terms of weight) of all building non-hazardous materials.
Figure 78 shows indicator thresholds adopted to associate the indicator score to an indicator performance class in the case of B.6.3, considering the above sources. While these thresholds and performance classes are not directly applied in the evaluation of KPI and dimension scores and performance classes, they are included here to assist users in determining appropriate performance levels for specific project aspects and to offer clear guidance on their improvement.
Figure 78. B.6.3 indicative performance classes and thresholds.

Source: JRC.
4.9.5 Example (B.6)
In the following example a newbuild project type for non-residential main use is considered. The assessment is carried out at the building scale and no listed cultural heritage is affected by the project. All upper levels of a six-storey office building consist of external cross laminated timber (CLT) walls and slabs combined with an internal timber pillar and beam structure. The ground storey consists of reinforced concrete walls and foundations. The wooden exterior cladding is connected to sawn timber battens that create a ventilated cavity. Wood fibre insulation is used for the vertical walls, while mineral wool is used for the roof. To ensure fire-safety, most of the panels are covered by gypsum plasterboard.
Starting from B.6.1 and the assessment of the durability of structural materials, the factor method in ISO 15686-8 (ISO, 2008) is employed for timber (Table 104), considering a reference service life of 50 years and a normal quality of components, indoor and outdoor environment, in-use conditions and maintenance level factors. The project is characterised by a high quality of design and work execution, especially in the planning of processes and detailing of elements, ensuring that the timber is well-protected from the outdoor environment and moisture throughout all phases of its life cycle, including construction. Therefore, a value of 1.2 is assigned to the quality of design and the quality of work execution factors, while a value of 1.0 is considered for the other factors, resulting in an estimated service life of 72 years.
Table 104. Application of the factor method to estimate service life of elements.
| Element | Timber | Exterior cladding |
| Reference service life (years) | 50 | 35 |
| Quality of components | 1.0 | 1.0 |
| Design level | 1.2 | 1.0 |
| Work execution level | 1.2 | 1.0 |
| Indoor environment | 1.0 | 1.0 |
| Outdoor environment | 1.0 | 0.8 |
| In-use conditions | 1.0 | 1.0 |
| Maintenance level | 1.0 | 1.0 |
| Estimated service life (years) | 72 | 28 |
Source: JRC.
For reinforced concrete, the possible degradation mechanisms are identified based on the class of exposure. Mix design and detail specifications are defined to ensure avoidance of these mechanisms; moreover, a full probabilistic estimation of chloride-induced corrosion is conducted, resulting in less than 10% probability of corrosion initiation within 100 years, which is assumed as the estimated service life.
Given that both materials account for more than 25% of the structure costs, they are both considered in the assessment. The first metric of B.6.1 indicator (i.e. service life of structural materials in Table 100) depends on the one with the shortest service life, namely timber, scoring 100 (Table 105).
The main exterior finishes consist of timber cladding elements. To estimate their service life, the factor method (ISO, 2008) is employed, considering a reference service life of 35 years (Table 104). Due to the expected weathering, especially for the walls characterised by the worst exposure, a poor level for the outdoor environment factor is considered, with a value of 0.8, while normal conditions are considered for the remaining factors. The estimated service life is thus reduced to 28 years, resulting in a score of 67 for the second metric of the B.6.1 indicator (i.e. service life of exterior finishes) in Table 105.
The main interior finishes are composed of plasterboards, for which an estimated service life of 30 years is considered, resulting in a score of 100 for the third metric of B.6.1 (i.e. service life of interior finishes).
Service ducts comprise different materials and jointing methods. The three most used types in the building are copper (hot water), PVC (water supply, sewage and ventilation) and aluminium (rainwater drainage). All of them have an estimated service life between 30 and 40 years, corresponding to a score of 67 for the metric of service life of HVAC, water supply and drainage pipe systems.
Finally, major electrical and mechanical equipment has an estimated service life of 15 to 30 years, resulting in a score of 67 for the last metric of Table 105.
The above result in B.6.1 score equal to 80.2 (corresponding to Excellent performance).
Table 105. Example of B.6.1 evaluation.
| Metric | Score | Weight (w) |
| Service life of structural materials (single selection allowed): | ||
| ≥ 70 years | 100 | 0.2 |
| Service life of exterior finishes (single selection allowed): | ||
| 20 – < 30 years | 67 | 0.2 |
| If [non-residential project type] has been selected, service life of interior finishes (single selection allowed): | ||
| ≥ 20 years | 100 | 0.2 |
| Select single value below: | ||
Heating, ventilation, and air conditioning (HVAC) system is present. HVAC system is not present. | √ Check next metrics. x | |
| If [HVAC systems is present], service life of HVAC, water supply and drainage pipe systems (single selection allowed): | ||
| At least two out of the top three most used pipe system types (in terms of weight) > 30 years. | 67 | 0.2 |
| Service life of major equipment and services (single selection allowed): | ||
| 15 – < 30 years | 67 | 0.2 |
| Indicator score = Σ(metric score · weight) | 80.2 | |
Source: JRC.
Regarding the evaluation of the adaptability indicator (Table 106), limited changes to the internal space distribution are allowed. In particular, columns have a minimum spacing of 5.5 m. Walls are non-load bearing and movable but require disassembly. Additionally, a large spacing between openings, approximately 1.9 m is designed. Several accesses to the building are defined and, at each floor, rooms and spaces can be organised in independent units of about 190 m2 on average.
The design allows moderate changes to the building services. The service ducts are located below the ceiling and left exposed, allowing complete accessibility and high flexibility. Plant rooms are located at the ground floor with easy external access and longitudinal cable ducts are deployed in one direction. Internal height is slightly larger than 3.0 m. Individual servicing for sanitary facilities is possible for subdivisions of spaces, on average equal to 380 m2, as two independent units are served by the same facility.
Finally, limited changes are allowed to the structure. The building features load bearing façades with obstacles. A redundant load-bearing capacity of slabs equal to 2.5 kN/m2 is estimated and the structural design allows an expansion of 2 storeys. This corresponds to an overall value of B.6.2 equal to 41.3 (corresponding to Acceptable performance).
Table 106. Example of B.6.2 evaluation.
| Metric | Score | Weight (w) |
| Changes to the internal space distribution: | ||
| Column grid spans: Minimum spacing of vertical load-bearing elements (single selection allowed): | ||
| 5400 – < 8100 mm | 33 | 0.04 |
| Façade pattern: Spacing between openings (single selection allowed): | ||
| ≥ 1800 mm | 0
| 0.04 |
| Internal wall system (single selection allowed): | ||
| Movable interior walls, require disassembly. | 67 | 0.14 |
| Unit size and access: Average portion of floor area that can be used separately from other spaces (single selection allowed): | ||
| < 200 m2 | 100 | 0.10 |
| Changes to the building services: | ||
| Ease of access to service ducts: Location of key service ducts (single selection allowed): | ||
| Below one building layer (ceiling), exposed or easily removable cover. | 100 | 0.04 |
| Ease of access to plantrooms (single selection allowed): | ||
| Located on the ground floor with easy external access. | 67 | 0.04 |
| Longitudinal ducts for service routes (single selection allowed): | ||
Cable duct in 1 direction
| 33
| 0.04 |
| Higher ceilings for service routes: If [non-residential project type] has been selected, internal height (floor surface to structural surface for at least 95% of the floor area) (single selection allowed): | ||
3000 – < 3500 mm
| 33
| 0.14 |
| Services to sub-divisions: Average portion of floor area that can be serviced by a sanitary facility (single selection allowed): | ||
| 200 – < 400 m2 | 67 | 0.10 |
| Changes to the building façade and structure: | ||
| Façades (single selection allowed): | ||
Bearing façade with bearing obstacles1
| 0
| 0.14 |
| Futureproofing of load bearing capacity of floors: Imposed loads (at least for 75% of the floor area): (single selection allowed): | ||
| 2.00 kN/m2 | 0 | 0.14 |
| Structural design to support future expansion: Capacity to add storeys (single selection allowed): | ||
2 storeys
| 33
| 0.04 |
| Indicator score = Σ(metric score · weight) | 41.3 | |
1 Examples of obstacles include bearing interior walls, columns, elevator shafts or installation ducts.
Source: JRC.
Finally, regarding B.6.3, design for deconstruction principles are well integrated into the project. Considering the whole building, wood materials comprise 44% of the full weight. 75% of wood materials are designed to be directly reused (e.g. most of wall and floor panels are designed to be disassembled with a minimum loss of material due to the removal of the connectors). The remaining 25%, which are expected to be unusable at the end of its life, are allocated for energy recovery. 36% of the building weight is composed of reinforced concrete, ceramic and natural stones and 11% in weight is gypsum. All these materials are designated for mixed stream recycling. Glass and other metal (such as windows, connectors, etc.) account for 6.5% of the building weight. Of this, 80% is expected to be easily repaired and manufactured to be functional again (prepared for reuse), whereas 20% is anticipated to be in poor condition at the end of its life and is, thus, directed to pure stream recycling, namely to facilities that are capable of separately processing the materials. Non-recyclable insulation materials, classified as hazardous waste, account for 1.5% of the building weight, while services and equipment make up approximately 1% of the building weight and are directly reusable. These end-of-life outcomes provide a score of 64.8 for B.6.3 (corresponding to Good performance).
Table 107. Example of B.6.3 evaluation.
| Building element | Q (expressed as percentage of building weight) | c | Waste hierarchy |
| Wood elements | 33 | 1.00 | Direct reuse |
| 11 | 0.15 | Energy recovery | |
| Reinforced concrete, ceramic and natural stone elements | 36 | 0.50 | Mixed stream recycling |
| Gypsum elements | 11 | 0.50 | Mixed stream recycling |
| Glass and other metal | 5.2 | 0.90 | Preparing for reuse |
| 1.3 | 0.75 | Pure stream recycling | |
| Non-recyclable insulation materials | 1.5 | 0.00 | Hazardous waste disposal |
| Services and equipment | 1 | 1.0 | Direct reuse |
| Indicator score | 64.8 | ||
Source: JRC.
B.6 KPI score is estimated according to Equation (140) equal to 60, corresponding to a Good performance class and a performance class score of PCSB.6 = 70.
4.10 Ensuring high level of aesthetic acceptance of buildings and spaces (B.7)
4.10.1 Description and assessment
The aesthetic acceptance and perception of buildings and spaces are related to the experience of architecture and urban planning by users and/or observers, thus depending on the interaction of users with the built environment through the senses. Aesthetic experience can be understood as the interplay of sensory-motor, emotion-valuation, and knowledge-meaning systems. Due to the dominance of the sense of sight in the relationship between users and the built environment, Ensuring high level of aesthetic acceptance of buildings and spaces (B.7) KPI aims to draw attention in architectural and urban design not only to the imperative of satisfying basic functional needs, but also to the unique experiences that activate the different sensory impulses of the audience. A high-quality built environment should be sensory‑inclusive and not risk cognitive overload. Indicators of the quality of the aesthetic experience refer to both its attentive, cognitive and affective aspects, as well as to the multisensory perception of buildings and spaces.
Ensuring high level of aesthetic acceptance of buildings and spaces (B.7) KPI is evaluated through the following two indicators to assess the features that allow positive sensory acceptance of buildings and spaces:
- Visual experience of architecture and space (B.7.1).
- Multisensory experience of architecture and space (B.7.2).
B.7 score, ranging from 0 to 100, is estimated according to Equation (144).
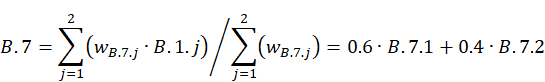
(144)
Figure 79 provides the B.7 KPI performance classes and thresholds adopted in the self-assessment method. Hence, the four ranges of B.7 score equal to 0 ≤ B.7 < 20, 20 ≤ B.7 < 50, 50 ≤ B.7 < 80, and 80 ≤ B.7 ≤ 100, correspond to Low, Acceptable, Good, and Excellent performance class, respectively. It is highly recommended that B.7 attains as a minimum the Acceptable performance class highlighting the KPI high significance based on expert opinion. This recommendation stems from the lack of standards, guidelines and other certification documents on the aesthetic perception by users of buildings and spaces through the senses. B.7 illustrates the project level of commitment to promoting solutions that foster the multisensory perception of architecture.
Figure 79. B.7 performance classes and thresholds.

Source: JRC.
The B.7 KPI and its corresponding indicators are designed to be implemented at building, neighbourhood and urban scale, including both newbuild and renovation projects, and both residential and non-residential use. However, the visual experience of architecture and space (B.7.1) indicator is evaluated trough different metrics, developed ad hoc depending on building or neighbourhood/urban scale to which the indicator is applied, as described in detail in Section 4.10.2.
4.10.2 Visual experience of architecture and space (B.7.1)
The visual experience of architecture and space(B.7.1) indicator assesses the use of solutions that support and promote a positive visual experience in the aesthetic experience of architecture. B.7.1 indicator, due to its interdisciplinary nature, is assessed through the two following metrics:
- Visual richness (VR), which refers to the static factors determining the highest level of aesthetic acceptance.
- Attractiveness of circulation (AC), which refers to the dynamic aspects influencing the perception of architecture forms and spaces. Depending on project scale, the attractiveness of circulation metric differs in attractiveness of circulation at building scale (ACb) and attractiveness of circulation at neighbourhood/urban scale (ACn/u).
B.7.1 score is evaluated as the weighted average of the scores of the two metrics above, according to Equation (145) or (146), depending on whether the assessment is carried out at building or neighbourhood/urban scale, respectively.
(145)
(146)
Visual richness (VR) metric for the evaluation of B.7.1 indicator deals with the perception of visual pleasure in relation to buildings, neighbourhood, or urban scale projects, which is inextricably linked to the concept of aesthetic unity, assumed as the most important principle for achieving semantic, visual and functional integrity. The aesthetic unity refers to the coexistence of all parts/elements of a building or a neighbourhood/urban layout that form (irrespective of the chosen style) a harmonious whole.
The VR score is evaluated as the weighted average of four sub-metrics, i.e. order (O), contrast (C), transparency (T), and novelty (N) (Nia and Atun, 2016, Coburn et al., 2017), according to Equation (147).
(147)
Order (O) sub-metric is a design principle in architecture and leads to a structural layout balance and an aesthetic balance in the architectural composition and/or visual hierarchy. All elements of a building, seen by the human eye, are considered, thus including spaces bounded by vertical, horizontal or sloping partitions, the composition (divisions) of these partitions, structural elements, and equipment. Order can be represented by four different layouts, i.e. repetitive, symmetrical, asymmetrical, and curvilinear. Order implies unity of design, thus no randomness is considered in the selection of architectural elements.
Order sub-metric measures whether a project applies four order principles (Ching, 2015, Hashimoto, 2003), i.e. (i) axis composition, (ii) hierarchy, (iii) transformation, and (iv) rhythm/repetition. The presence or absence of each of the four order principles in a project provides four scores, each corresponding to a positive (in the case of presence) or a zero (in the case of absence) value, which are assigned according to the rationale presented in Table 108. The sum of the four scores results into the order (O) score, ranging from 0 (i.e. absence of all order principles) to 100 (i.e. presence of all order principles). Definitions of the four order principles are provided in the List of abbreviations, symbols and definitions section, and various layout examples for each order principle potentially applied to a project are provided in Figure 80 to facilitate the evaluation of the sub-metric score. The preference for specific types of aesthetic forms is not considered in the score evaluation, as there are no unambiguous criteria useful for determining the major value of an aesthetic form type compared to another. For example, symmetrical or asymmetrical compositions of forms are considered equivalent, so neither of them is preferred. Similarly, the presence of one compositional axis is as valuable as the presence of several compositional axes at the same time. The four order principles can be found in various visually perceived spaces, i.e. on building façades and in street and square frontages, in floor divisions (both in enclosed and open spaces), on walls and ceilings, in the spatial distribution of structural elements of a building (e.g. distribution of columns according to the structural layout of a building, etc.).
Table 108. Order (O) sub-metric score.
| Order principle | Score |
| Indicate the presence, i.e. yes, or absence, i.e. no, of each of the four order principles below and sum the corresponding ‘yes’ scores | |
The project applies the following four order principles: Axis composition [Figure 80a]. Hierarchy [Figure 80b]. Transformation [Figure 80c]. Rhythm/repetition [Figure 80d]. |
If yes, +25. If no, 0 If yes, +25. If no, 0 If yes, +25. If no, 0 If yes, +25. If no, 0 |
| Order (O) sub-metric score = Σ (‘yes’, ‘no’ scores) | 0 ≤ O ≤ 100 |
Source: JRC.
Figure 80. Examples of the four order principles: (a) axis composition, (b) hierarchy, (c) transformation, and (d) rhythm/repetition of columns, grids and masses.
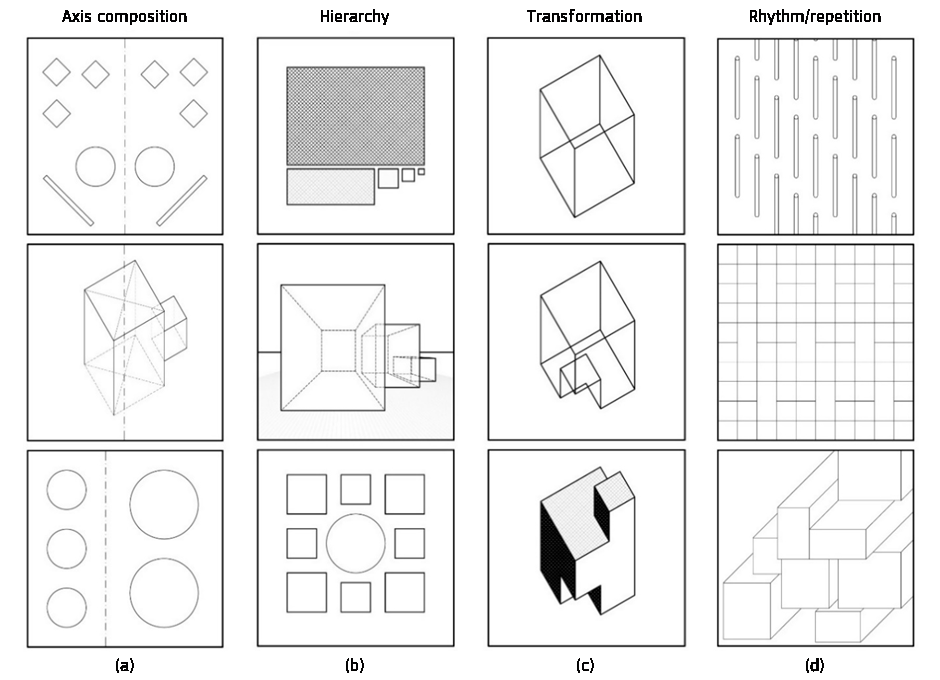
Source: JRC.
Contrast (C) sub-metric is defined as the juxtaposition of opposing elements of an architectural or urban composition (in terms of shapes, materials, colours and textures) in order to emphasise the difference between them and achieve a more dynamic expressiveness. The use of contrasts aims to expose selected architectural elements and create a sense of balance and harmony in the architectural composition of a building, a neighbourhood or an urban layout, so higher levels of contrast can enhance the aesthetic value of a designed building, a neighbourhood or an urban space. Contrast attracts observers’ attention, helps to address users' interest in a particular direction, emphasises selected elements and adds variety.
Contrast sub-metric measures whether a project is characterised by the inclusion of contrast concerning four elements, i.e. (i) massing (e.g. 'light' and 'heavy' volumes), (ii) lines and spaces, (iii) surfaces and apertures, (e.g. light and dark surfaces), and (iv) materials, assuming the inclusion of contrast as a positive factor enhancing the experience of pleasure in the perception of architecture and space. The presence or absence of each of the four contrasting elements in a project provides four scores, each equal to a positive (in the case of presence) or a zero (in the case of absence) value, which are assigned according to the rationale in Table 109. The sum of the four scores provides the contrast (C) sub-metric score, ranging from 0 (i.e. absence of all contrasting elements) to 100 (presence of all contrasting elements). Definitions of massing, aperture, and surface elements are provided in the List of abbreviations, symbols and definitions section, and layout examples of the four contrasting elements potentially included into a project are depicted in Figure 81 to facilitate the evaluation of the sub-metric score. It is worth noting that the shapes, colours, and textures of juxtaposed elements are not considered in detail in the evaluation of the contrast sub-metric score, due to the huge variety of spatial architectural solutions.
Table 109. Contrast (C) sub-metric score.
| Contrasting element | Score |
| Indicate the presence, i.e. yes, or absence, i.e. no, of each of the four contrasting elements below and sum the corresponding four scores. | |
The project is characterised by the contrast of the following four elements, i.e. massing, lines/spaces, surfaces and apertures, and materials:
|
If yes, + 25. If no, 0 If yes, + 25. If no, 0 If yes, + 25. If no, 0 If yes, + 25. If no, 0 |
| Contrast (C) sub-metric score = Σ (‘yes’, ‘no’ scores) | 0 ≤ C ≤ 100 |
Source: JRC.
Figure 81. Examples of compositions of the four contrasting elements: (a) massing, (b) lines and spaces, (c) surfaces and apertures, and (d) materials.
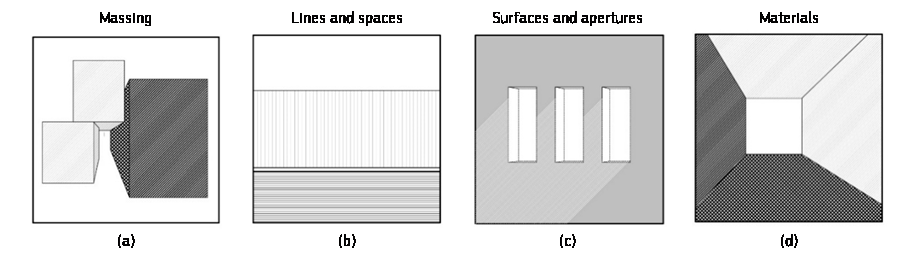
Source: JRC
Transparency (T) sub-metric relies on the general concept of transparency that describes the characteristics of a material, and the visual clearness of partitions of a building ensuring that enclosed spaces are exposed to light and air. Partitions are understood as building elements with the primary function of separating two usable spaces from each other; partitions can be walls of various kinds, but also screens, furniture, etc.. The transparency of partitions strengthens the relationship between the outside and the inside. In a broader sense, transparency means playing with perception, the interpenetration of successive planes, the deliberate disruption of the sense of depth and distance. Diverse visual effects can be achieved by using materials with different levels of transparency in both building interiors and neighbourhood/urban compositions. Fully translucent glazing offers the possibility of visually combining the interiors of a building or the inside of a building with the outdoor environment. Partitions with less transparency can reduce the inflow and intensity of light, distort the image or produce a variety of optical impressions. A high degree of design sophistication is evidenced by the ability to create a 'play of light and shadow' (i.e. chiaroscuro), intended as the design of visual interactions based on guiding natural light streams (e.g. illuminating a specific point/plane, deliberately providing diffuse light, etc.) and shaping shadow (e.g. as a result of shadow falling on non-transparent planes). The light-shadow effect depending on the time of day and year is particularly valuable. Indeed, the ‘control’ of the visual effects resulting from the incidence of natural light and the creation of shadow at different times of the day, or year contributes to a suggestive atmosphere of a place and its natural visual variability.
Transparency sub-metric measures whether the aforementioned concepts, translated into four transparency‑related aspects concerning (i) building interior-exterior visual contact, (ii) openings towards landscape, (iii) play of light and shadow, and (iv) light-shadow effects, are included in a project. The inclusion or lack of each of the four transparency-related aspects in a project results into four scores, each equal to a positive (in the case of inclusion) or a zero (in the case of lack) value, which are assigned according to the rationale provided in Table 110. The sum of the four scores provides the transparency (T) score, ranging from 0 (i.e. lack of all aspects) to 100 (inclusion of all aspects). Figure 82 provides layout examples of the four transparency-related aspects in architecture, potentially included into a project, to facilitate the evaluation of the sub-metric score.
Table 110. Transparency (T) sub-metric score.
| Transparency-related aspects | Score |
| Indicate the presence, i.e. yes, or absence, i.e. no, of each of the four transparency-related aspects below and sum the corresponding four scores. | |
The project is characterised by the following four transparency-related aspects:
| If yes, + 25. If no, 0.
If yes, + 25. If no, 0.
If yes, + 25. If no, 0.
If yes, + 25. If no, 0. |
| Transparency (T) sub-metric score = Σ (‘yes’, ‘no’ scores) | 0 ≤ T ≤ 100 |
Figure 82. Examples of transparency-related aspects in architecture: (a) interior-exterior visual contact, (b) openings, (c) play of light and shadow, and (d) light-shadow effects at different times of day/year.
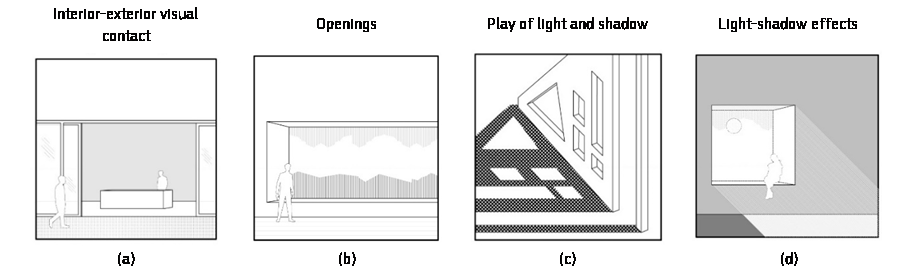
Source: JRC
Novelty (N) sub-metric focuses on the use of pioneering, over-the-top, unprecedented architectural/spatial solutions in a project resulting into a significative impact on the visual value of the building, neighbourhood or urban scale project. Pioneering solutions in aesthetics can include, for example, the use of structures that result from visionary construction systems, the application of completely new materials (structural, decorative, other) or known materials in unobvious, surprising ways, the incorporation of scientific achievements or the latest socio-cultural trends in the shaping of architectural and urban forms. The novelty sub-metric measures whether a project is characterised by the presence of two novelty-related aspects concerning (i) the inclusion of artwork, and (ii) the use of aesthetic pioneering solutions, thus resulting into two scores equal to a positive (in the case of presence) or a zero (in the case of absence) value, which are assigned according to the rationale provided in Table 111. The sum of the two scores, providing the novelty sub-metric score, ranges from 0 (i.e. absence of all novelty-related aspects) to 100 (presence of all novelty-related aspects).
Table 111. Novelty (N) sub-metric score.
| Novelty-related aspects | Score |
| Indicate the presence, i.e. yes, or absence, i.e. no, of each of the two novelty-related aspects below and sum the corresponding two scores. | |
The project is characterised by the following two novelty-related aspects:
|
If yes, + 50. If no, 0. If yes, + 50. If no, 0. |
| Novelty (N) sub-metric score = Σ ‘yes’ , ‘no’ scores | 0 ≤ N ≤ 100 |
Source: JRC.
Attractiveness of circulation (AC) metric for the evaluation of B.7.1 indicator refers to the variability of the visual interaction of a user with a building or a neighbourhood/urban composition during his/her movement. Architecture bases its existence on form and space, and their perception depends on the observer's movement, which also influences perception changes. The AC metric allows a three-dimensional (3D) assessment of the visual experience of architecture, beyond the two-dimensional one. The attractiveness of circulation metric is based on Le Corbusier’s idea of an 'architectural promenade' (Le Corbusier, 1923), which means a sequence of interconnected spaces within a building, neighbourhood, or urban project to be experienced in a specific order, often with the intention of guiding the user/observer through the space and highlighting certain architectural features or views (Samuel, 2010). Circulation refers to the way people move around and interact with a building, a neighbourhood, or an urban project. The user’s movement allows viewpoints to be multiplied, the interior of a building to be linked to its immediate surroundings and architecture to be experienced over time. The arrangement of the space must allow for continuous and uninterrupted movement, as depicted in (Figure 83) at both building and neighbourhood/urban scale. Different user experiences can emerge from the movement through an ‘architectural promenade’ (Figure 84), depending on its design. Indeed, an 'architectural promenade' can be divided into various sections designed to allow a user to move faster or slower, and it can incorporate changes of direction, as well as places for rest and reflection. The ideas of spatial orientation and proximity (i.e. approaching and moving away from a designated position) are also important for the user’s movement. The movement path is seen here as a perceptual thread that connects the spaces of a building or any series of indoor and outdoor spaces together.
Figure 83. Potential implementation of an ‘architectural promenade’ at (a) urban scale, and (b), (c), (d) building scale.
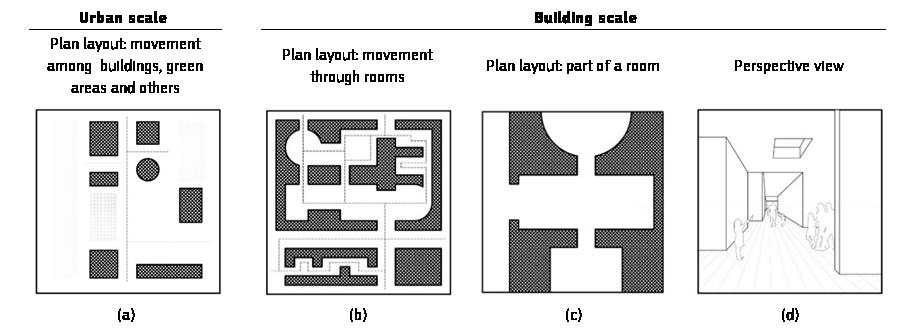
Source: JRC.
Figure 84. Potential user experiences based on the movement through an 'architectural promenade': (a) visual connection with the environment, communing with art, possibility to stop, (b) opening, physical connection with the environment, possibility to change the direction of movement, (c) change of lighting, contrast, play of shadows, change of room height, (d) change of slope of the path, contact with nature, perspective opening, (e) connection with vertical communication (stairs, lifts), change of path height, (f) possibility to change the speed of movement, use of space, (g) possibility to rest, contemplation, (h) direct contact with the natural world.
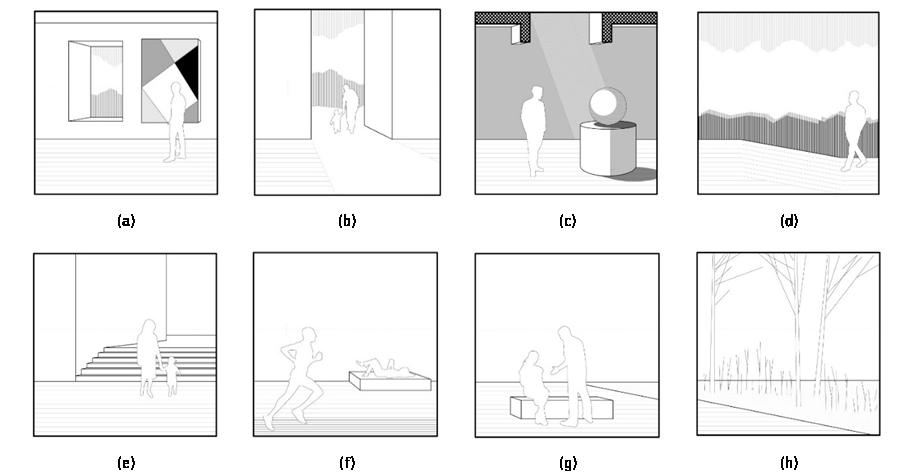
Source: JRC.
The AC metric differs depending on the project spatial scale considered. Specifically the evaluation of the AC metric at building (ACb) and neighbourhood/urban (ACn/u) scales is provided separately in the following.
The attractiveness of circulation at building scale(ACb) relies on the concept of the 'architectural promenade' focusing on the following five elements (Ching, 2015) for its composition:
- Approach deals with a twofold aspect of an ‘architectural promenade’ composition related to (i) the first view and (ii) the exposition of a building. Indeed, the approach is the first element for the composition of an 'architectural promenade' aimed at preparing the observer to see and experience the interior of a building. The approach can be designed in contrast to the interior space or, conversely, it can be the first space of a sequence, thus blurring the visual differences between the interior and the exterior of a building. The model chosen for the approach (Figure 85) allows for either a partial or multifaceted view of the building and can be used to expose the building in the best possible and most surprising way.
Figure 85. Models of approach to a building
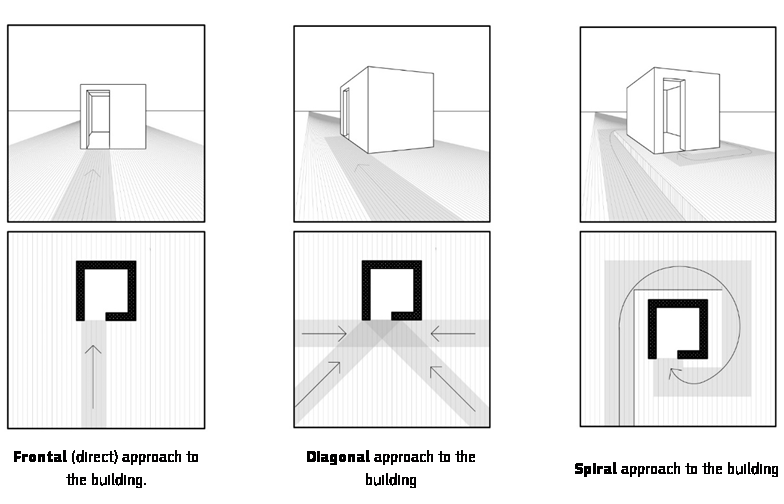
Source: JRC.
- Entrance (from outside to inside) refers not only to the physical passage between the exterior and the interior of a building, but also to the interior space associated with the entrance, which is an invitation to explore the building and a node for the distribution of movement.
- Configuration of the path refers to the arrangement of connections within a sequence of spaces. All paths for the movement of people and vehicles have a linear configuration, characterised by a starting and an ending point, as well as intersections with other paths and spaces (Figure 86). The form and scale of entrances and paths should emphasise the functional and symbolic distinction between spaces. The nature of the pathway configuration both influences and is influenced by the organisational pattern of the connecting spaces. Path does not literally mean a lane, alley or footpath. It is a possible way for people to move through space (Figure 87), including open spaces, such as squares. The path does not have to be flat; necessarily; it can change the height levels, rise or descend, and vertically connect different planes by means of stairs, ramps, and lifts (Figure 88).
Figure 86. Configuration of paths for people movement
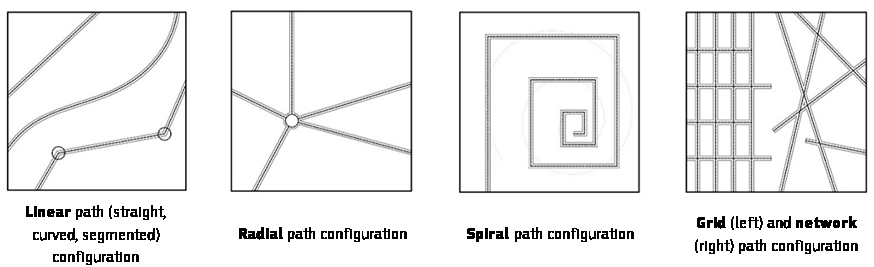
Source: JRC.
Figure 87. Spatial solutions to support the decision-making of space users regarding the choice of movement direction (the number of path intersections enhances the decision-making process).
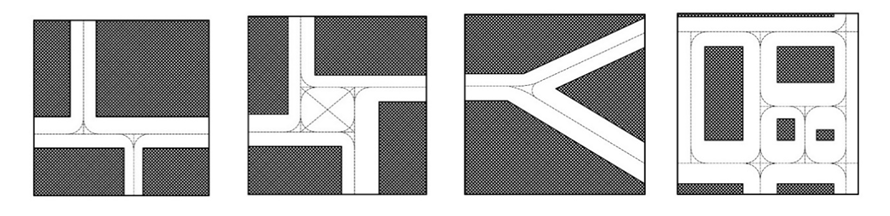
Source: JRC.
Figure 88. Path alignment: (a) flat, (b) multi-level with direct vertical connection using stairs, (c) ramps or (d) sloping terrain.
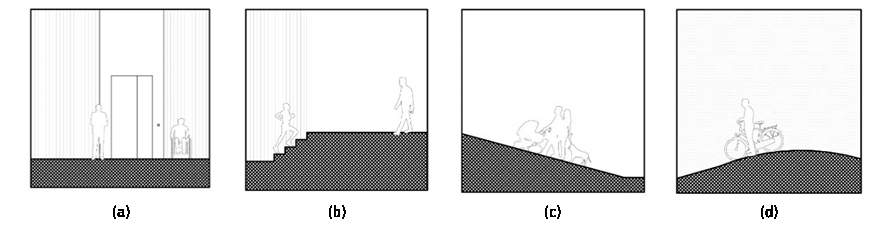
Source: JRC.
- Path-space relationships identify ways in which paths are linked to spaces (interiors in buildings/urban interiors), leading the position of a path to have a direct impact on the users’ perception. Paths can be tangential to sequences of spaces, so that the spaces remain distinct. Paths can be routed through spaces axially, diagonally or along their edges, opening up many possibilities for arrangement (Figure 89).
Figure 89. Path-space relationship
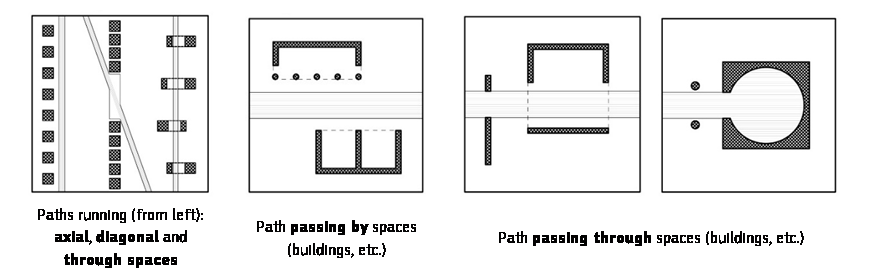
Source: JRC.
- Form of the circulation space, which is an integral part of the layout of any building, along with its scale should take into account the volume of traffic, the number of users, the stopping places, the resting places, and the proxemics (Figure 90).
Figure 90. Form of the circulation space and proxemics
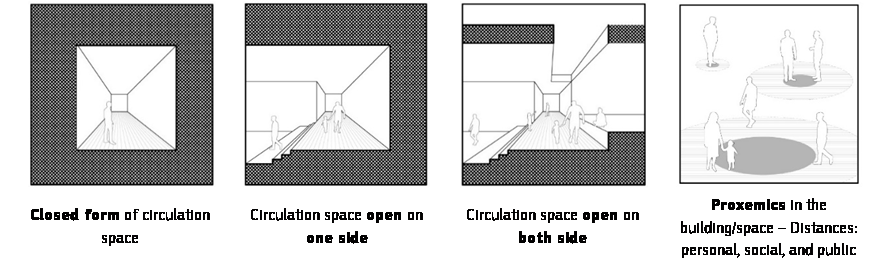
Source: JRC.
Attractiveness of circulation at building scale (ACb) evaluates the extent to which design solutions related to the five elements of the composition of the 'architectural promenade' that positively influence the perception of the forms and spaces of the building are included in a building project. The rationale for the evaluation of ACb score is summarised in Table 112. ACb score can be equal to four different fixed values (i.e. 0, 40, 70, 100) indicative of four performance classes (i.e. low, acceptable, good, and excellent) of the attractiveness of circulation attained, noting though that metric performance classes are not used in the current version of the self-assessment method.
Table 112. Attractiveness of circulation at building scale (ACb) sub-metric score.
| Sub-metric | Score |
| Select single value below. | |
The project includes the following design solutions related to the ‘form of the circulation space’ element: Form of the circulation space The form and scale of circulation spaces take into account the movement of people, and the opportunity to stop and rest. | 0 (Low) |
The project includes the following design solutions related to the ‘form of the circulation space’ element: Form of the circulation space Differentiated proxemics are included in the building by considering the following distances: public (3.7 m to 7.6 m and more), social (1.2 m to 3.7 m) and personal (0.45 m to 1.2 m) (Hall, 1966) (Figure 90) | Check the next three groups of design solutions below (select single value) |
The project includes at least three of the following design solutions related to the five elements of the architectural promenade: Approach Frontal, direct approach, i.e. a straight, axial path terminating in an entrance to the building or a defined space within the building (Figure 85). Entrance The boundary between the exterior and interior of the building is clear, the location of the entrance is marked by a defined spatial form. Configuration of the path A simple linear layout as an organising/connecting element of a series of spaces (e.g. rooms in a building) ( Figure 86). In the case of multi-level promenades, the levels are vertically connected (e.g. stairs, ramps, lifts) (Figure 88). Path-space relationship The path is independent and does not cross the space (e.g. it is located tangentially to rooms, spaces) (Figure 89). Form of the circulation space The path has a closed form and connects to the spaces through entrances in the wall planes (Figure 90). | 40 (Acceptable) |
The project includes at least half of all following design solutions related to the five elements of the architectural promenade and further features enhancing the user experience: Approach A diagonal approach that enhances the effect of perspective and allows a wider view of the front of the building and its entrance area (Figure 85). Entrance The entrance zone encourages exploration of the interior by providing transparency of the partitions/structural arrangement and legibility of the possible directions for further journey. Configuration of the path Advanced layouts of segmented lines, either radial or spiral layouts as organising/connecting elements of a sequence of spaces ( Figure 86). Supporting the choice of movement paths (Figure 87). In the case of multi-level promenades, the levels are vertically connected by semi-open stairs and ramps (Figure 88). Path-space relationship The path cuts through the spaces, allowing direct views of the interiors (Figure 89). Form of the circulation space The pathway has a one-side open form to provide visual and spatial continuity with the spaces it connects (Figure 90). Further features enhancing user experience The length of users' direct exposure to nature is between 25-50 % of the length of the entire promenade. | 70 (Good) |
The project includes at least half of all following design solutions related to the five elements of the architectural promenade and further features enhancing the user experience: Approach A spiral approach to the building, guided in a way that emphasises its three-dimensionality (Figure 85). Entrance The entrance to the building is a real or implied plane perpendicular to the path of approach, and the entrance area encourages exploration of the interior by providing clarity of partitions/structural layout and legibility of possible directions of further travel. Configuration of the path Advanced network layouts with hierarchical structured paths ( Figure 86). Nodal spaces that provide opportunities to stop, rest, change direction of movement (Figure 87). In the case of multi-level promenades, the levels are vertically connected by stairs and ramps, conceived as open interior elements (Figure 88). Path-space relationship The location/layout of the spaces determines the path modelling, and their relationship has been planned in such a way as to emphasise the functional or symbolic meaning of the particular interiors/spaces. Form of the circulation space The path has an open form (Figure 90). Further features enhancing user experience The length of direct exposure of users to nature exceeds 50 % of the length of the entire promenade. The design of the promenade includes the concept of integrating architecture and art at least in the entrance spaces/zones (WELL v2, IWBI, 2020). | 100 (Excellent) |
| ACb metric score = Selected sub-metric score | ACb = 0 or 40 or 70 or 100 |
Source: JRC.
The attractiveness of circulation at neighbourhood and urban scale (ACn/u) metric relies on four elements (i.e. paths, edges, nodes, and landmarks) of the city imageability theory (Lynch, 1964), which are perceived by the observers to shape their view of the built environment, thus ‘experiencing the city’. The metric is also based on the concept of the 'architectural promenade' and biophilic design paradigms.
Acn/u score is evaluated as the weighted average of four sub-metrics, i.e. paths (P), edges (E), nodes, and landmarks (L) (Lynch, 1964), according to Equation (148):
(148)
Paths (P) refer to 'corridors' of movement identified bystreets, pavements, pedestrian areas, tram and rail lines, waterways, etc. at urban scale to provide continuous 'traffic channels' and a safe connection between spaces with different functions. Paths designed for pedestrians need to be friendly to users with different mobility abilities. Further explanations concerning the concept of path can be also found in the description of configuration of the path and path-space relationship elements of the architectural promenade composition in the ACb metric.
Paths sub-metric measures whether a project at neighbourhood or urban scale satisfies seven specific design characteristics related to the paths (as indicated in Table 113). The presence or absence of each of these seven characteristics provides seven partial scores, each equal to a positive (in the case of presence) or a negative (in the case of absence) values, which are assigned according to the rationale summarised in Table 113. The sum of the seven scores estimates the paths (P) sub-metric score, ranging from 0 (absence of all design characteristics) to 100 (presence of all design characteristics).
Table 113. Paths (P) sub-metric score.
| Path design characteristic | Score |
| Indicate the presence, i.e. yes, or absence, i.e. no, of each of the seven design characteristics below and sum the corresponding seven scores. | |
The project includes the following design solutions related to the paths:
|
If yes, + 20. If no, 0. If yes, + 20. If no, 0. If yes, + 12. If no, 0.
If yes, + 12. If no, 0.
If yes, + 12. If no, 0. If yes, + 12. If no, 0.
If yes, + 12. If no, 0. |
| Paths (P) sub-metric score = Σ (‘yes’, ‘no’ scores) | 0 ≤ P ≤ 100 |
Source: JRC.
Edges (E) are both physical and symbolic boundaries. At neighbourhood or urban scale, edges can be continuous building lines, riverbeds, as well as lines that define transitions between different spaces. An edge can also refer to the interface between a building and its neighbourhood. A boundary can be a spatial barrier, making it difficult or even impossible to cross, or it can be merely a spatial 'signal' informing for a change of land use, material, aesthetics. It is important to consider this potential restriction of access or view in the design, thus avoiding randomness. The boundary with the strongest impact on users is characterised by continuity and logic. The continuity of a boundary can be achieved, by clear compositional lines in vertical spaces (i.e. walls, ramparts, etc.) or horizontal spaces (i.e. floors, building boundaries, river lines, paths), repeated spatial or point arrangements (including greenery). At the architectural scale, an edge can be a material partition, but also a line deliberately hidden to create a sense of continuity between the interior and exterior of a building.
Edges sub-metric assesses whether a project at neighbourhood or urban scale satisfies three specific design characteristics for the edges (as indicated in
Table 114). The presence or absence of each of these three characteristics provides three corresponding partial scores, each equal to a positive (in the case of presence) or a negative (in the case of absence) value, which are assigned according to the rationale summarised in Table 113. The sum of the three scores estimates the edges (E) sub-metric score, ranging from 0 (absence of all design characteristics) to 100 (presence of all design characteristics).
Table 114. Edges (E) sub-metric score.
| Edges design characteristics | Score |
| Indicate the presence, i.e. yes, or absence, i.e. no, of each of the three design characteristics below and sum the corresponding three scores. | |
The project includes the following design characteristics related to the edges:
|
If yes, + 35. If no, 0.
If yes, + 35. If no, 0.
If yes, + 30. If no, 0.
|
| Edges (E) sub-metric score = Σ (‘yes’, ‘no’ scores) | 0 ≤ E ≤ 100 |
Source: JRC.
Nodes are defined as central places in urban layouts, where lines of communication can converge, but they can also be multifunctional spaces, pedestrian-friendly and suitable for use by large groups of people. Nodes are accessible, they are points of connection and interaction, places of contact. They can be closed (when they are limited by clear boundaries, visual or physical barriers), open (when they open up to their surroundings, such as natural landscapes) or semi-open, understood as a combination of the characteristics of the two previous types.
Nodes sub-metric assesses whether a project at neighbourhood or urban scale includes four specific design characteristics for the nodes (as indicated in Table 115). The presence or absence of each of these four characteristics provides four corresponding partial scores, each equal to a positive (in the case of presence) or a negative (in the case of absence) value, which is assigned according to the rationale summarised in Table 115. The sum of the four scores estimates the nodes sub-metric score, ranging from 0 (lack of all design characteristics) to 100 (inclusion of all design characteristics).
Table 115. Nodes sub-metric score.
| Nodes design characteristics | Score |
| Indicate the presence, i.e. yes, or absence, i.e. no, of each of the four design characteristics below and sum the corresponding four scores | |
The project provides the following design solutions related to the nodes:
|
If yes, + 25. If no, 0.
If yes, + 25. If no, 0.
If yes, + 25. If no, 0. If yes, + 25. If no, 0. |
| Nodes sub-metric score = Σ (‘yes’, ‘no’ scores) | 0 ≤ Nodes ≤ 100 |
Source: JRC.
Landmarks (L) are points of orientation, signs and symbols that are distinctive and easily recognisable. Landmarks tend to be focal points for observers and are also elements of urban identity.
Landmarks sub-metric assesses whether a project at neighbourhood or urban scale satisfies five specific design characteristics for the landmarks (as indicated in Table 116). The presence or absence of each of these five design characteristics provides five partial scores, each equal to a positive (in the case of presence) or a negative (in the case of absence) value, which is assigned according to the rationale summarised in Table 116. The sum of the five scores estimates the landmarks (L) sub-metric score, ranging from 0 (absence of all design characteristics) to 100 (presence of all design characteristics).
Table 116. Landmarks (L) sub-metric score.
| Landmarks design characteristics | Score |
| Indicate the presence, i.e. yes, or absence, i.e. no, of each of the five design characteristics below and sum the corresponding five scores | |
The project includes the following design characteristics related to landmarks:
|
If yes, + 20. If no, 0. If yes, + 20. If no, 0. If yes, + 20. If no, 0. If yes, + 20. If no, 0. If yes, + 20. If no, 0. |
| Landmarks (L) sub-metric score = Σ (‘yes’, ‘no’ scores) | 0 ≤ L ≤ 100 |
Source: JRC.
4.10.3 Multisensory experience of architecture and space (B.7.2)
The multisensory experience of architecture and space (B.7.2) indicator refers to the sensory, but non-visual, impact of the built environment, which can stimulate users on a social, cognitive and emotional level (Spence, 2020). B.7.2 is assessed through the following three metrics:
- Tactile richness (TR).
- Auditory richness (AR).
- Olfactory richness (OR).
B.7.2 score is evaluated as the weighted average of the scores of the three metrics above, according to Equation (149), in which the values assumed for the metric weights depend on the human brain sensitivity to the information conveyed through each specific human sense (Spence, 2020).
(149)
The tactile richness (TR) metric for the evaluation of the B.7.2 indicator concerns tactile experiences, which increase the engagement and satisfaction of users of buildings and urban open spaces. The improvement of these experiences can be achieved by using: differentiated materials and textures on all building surfaces with a particular focus on floors, as well as interior furnishings providing a sense of comfort. Since tactile receptors are located all over the human body, tactile sensory experience can be realised through a set of activities, ranging from walking (i.e. contact with the floor), sitting/lying, touching surfaces and furnishings. The tactile sensory experience is enhanced by the use of textures with a variety of physical characteristics, such as smooth-rough, bumpy-flat, hard-soft, slippery-sticky, wet-dry, or by juxtaposing elements with different temperatures, e.g. warm-cold water.
The metric evaluates the extent to which the use of specific design solutions (as indicated in Table 117) allows a building, a neighbourhood or an urban scale project to be pleasantly experienced by users through their tactile sense. The rationale for the evaluation of the TR score is summarised in Table 117. TR score can be equal to four different fixed values (i.e. 0 40, 70, 100) indicative of four performance classes (i.e. low, acceptable, good, and excellent) of the tactile richness attained, noting though that metric performance classes are not used in the current version of the self-assessment method.
Table 117. Tactile richness (TR) metric score.
| Sub-metric | Score |
| Select single value below. | |
| The project provides a neutral tactile experience (i.e. no factor influences the tactile experience negatively) in terms of choice of finishing materials, i.e. floor and wall coverings, and furnishings. | 0 (Low) |
The project attains the low tactile richness and provides a pleasant tactile experience through the use of the following design solution:
| 40 (Acceptable) |
The project includes the design solutions to attain the acceptable tactile richness and provides an advanced tactile experience through the use of the following additional design solutions:
| 70 (Good) |
The project includes the design solutions to attain the good tactile richness and provides a more advanced tactile experience through the use of the following additional design solutions:
| 100 (Excellent) |
| TR metric score = Selected sub-metric score | TR = 0 or 40 or 70 or 100 |
Source: JRC.
The auditory richness (AR) metric for the evaluation of the B.7.2 indicator concerns the user experience related to the sound in buildings, neighbourhoods, and urban scale projects. The acoustic experience in buildings, neighbourhoods, and urban spaces tend to focus on ways of avoiding or minimising noise, i.e. 'unwanted sound'. However, sound can create an identity for a place, provide clues about the proportions of a space, and also suggest its functions. The sounds of nature are beneficial to the well-being of users of buildings and urban spaces and can also serve to mask the noise of the city (Gelfand, 2017).
The metric evaluates the extent to which the use of specific design solutions (as indicated in Table 118) allows a building, a neighbourhood or an urban scale project to be positively experienced by users through their auditory sense. The evaluation of the AR score is summarised in Table 118. AR score can be equal to four different fixed values indicative of four performance levels (i.e. low, acceptable, good, and excellent) of the auditory richness attained, noting though that metric performance classes are not used in the current version of the self-assessment method.
Table 118. Auditory richness (AR) metric score.
| Sub-metric | Score |
| Select single value below. | |
| The project provides a neutral sound experience (i.e. no factor influences the auditory perception negatively). | 0 (Low) |
The project exceeds the low auditory richness by providing an acoustic experience through the following design solutions:
| 40 (Acceptable) |
The project includes the design solutions to attain the acceptable auditory richness, and provides an advanced acoustic experience through the following additional design solutions:
| 70 (Good)
|
The project includes the design solutions to attain the good auditory richness, and provides a more advanced acoustic experience through at least two of the following additional design solutions:
| 100 (Excellent |
| AR metric score = Selected sub-metric score | AR = 0 or 40 or 70 or 100 |
Source: JRC.
The olfactory richness (0R) metric for the evaluation of B.7.2 indicator concerns the olfactory experience in buildings, neighbourhoods and urban scale projects. Smell is considered one of the means for memory creation, so the purposeful use of the olfactory sense can enrich the experience of building users. The inclusion of smell in architectural design is part of the development of solutions taking into account the relationship between all the sensory channels used to read and perceive the surrounding space. The olfactory sense is continuously active, so the absence or elimination of factors affecting this sense negatively should be considered as a starting point for an effective project, while the design of spaces that positively stimulate the sense of smell should be promoted.
The metric evaluates the extent to which the inclusion of specific design solutions (as indicated in Table 119) allows a building, a neighbourhood, or an urban scale project to be positively experienced by users through their olfactory sense. The evaluation of the OR score is summarised in Table 119. OR score can be equal to four different fixed values indicative of four performance levels (i.e. low, acceptable, good, and excellent) of the olfactory richness attained, noting though that metric performance classes are not used in the current version of the self-assessment method.
Table 119. Olfactory richness (OR) metric score.
| Sub-metric | Score |
| Select single value below. | |
The project provides a neutral olfactory experience (i.e. no factor influences the perception of building/ neighbourhood/urban project negatively). The project exceeds the low olfactory richness by providing an olfactory experience through the following additional design solutions:
The project includes the design solutions to attain the acceptable olfactory richness and provides an advanced olfactory experience through the following additional design solutions:
The project includes the design solutions to attain the good olfactory richness and provides at least two of the following additional design solutions:
| 0 (Low) 40 (Acceptable)
70 (Good)
100 (Excellent) |
| OR metric score = Selected sub-metric score | OR = 0 or 40 or 70 or 100% |
Source: JRC.
4.10.4 Example (B.7)
A free-standing public building, newly constructed in a historic environment, is considered. The four-storey building houses a contemporary art museum, shops, restaurants and artist studios. The scale of the building was adapted to the neighbouring buildings. The building is designed as a quadrangle with an inner courtyard, which is open to the general public (not exclusively to the direct users of the building). The courtyard forms part of the public space and the ground floor of the building is largely open (the structural elements of the building are visible). The courtyard features a green area and a water body, corresponding to a fountain (other water bodies can be a decorative reservoir, small pool, etc.), as well as an open-air amphitheatre and an outdoor art exhibition. The building exhibits several features of the contemporary modernism style, with its façades heavily glazed, rectangular forms, monochromatic colours specific for the building materials used. Additionally, a number of pro-ecological solutions can be observed, including exposure to natural light (diffused due to the building function), greenery in the interiors, natural materials in the interior arrangement, vertical green systems (VGS) and water body for evaporative cooling.
The evaluation of B.7 depends on the scores of visual experience of architecture and space (B.7.1) and multisensory experience of architecture and space (B.7.2) indicators, thus their estimation is first carried out.
B.7.1 score is evaluated through the following two metrics: (i) visual richness (VR) and (ii) attractiveness of circulation at building scale (ACb).
Visual richness (VR) metric is evaluated according to the four sub-metrics in Table 108, Table 109, Table 110, and Table 111. Specifically, order, contrast, transparency, and novelty sub-metric scores are based on the presence in the example building of two (out of four) order principles, three (out of four) contrasting elements, three (out of four) transparency-relayed aspects, and one (out of two) novelty-related aspects, respectively, as reported in
Table 120. Having evaluated the score for each sub-metric, the visual richness score is estimated according to Equation (147), as reported in (
Table 120).
Table 120. Example of visual richness (VR) metric evaluation
| Order principle | Score |
| Indicate the presence, i.e. yes, or absence, i.e. no, of each of the four order principles below and sum the corresponding ‘yes’ scores. | |
The project applies the following four order principles:
|
Yes, +25 No, 0 No, 0 Yes, +25 |
| Order (O) sub-metric score = Σ (‘yes’, ‘no’ scores) | O = 50 |
| Contrasting element | Score |
| Indicate the presence, i.e. yes, or absence, i.e. no, of each of the four contrasting elements below and sum the corresponding four scores, | |
The project is characterised by the contrast of the following four elements, i.e. massing, lines/spaces, surfaces and apertures, and materials:
|
No, 0 Yes, + 25. Yes, + 25 Yes, + 25 |
| Contrast (C) sub-metric score = Σ (‘yes’, ‘no’ scores) | C = 75 |
| Transparency-related aspects | Score |
| Indicate the inclusion, i.e. yes, or lack, i.e. no, of each of the four transparency-related aspects below and sum the corresponding four scores, | |
The project is characterised by the following four transparency-related aspects:
|
Yes, + 25 No, 0
Yes, + 25 No, 0 |
| Transparency (T) sub-metric score = Σ (‘yes’, ‘no’ scores) | T = 50 |
| Novelty-related aspects | Score |
| Indicate the presence, i.e. yes, or absence, i.e. no, of each of the two novelty-related aspects below and sum the corresponding four scores, | |
The following two novelty-related aspects are considered in the project:
|
Yes, + 50. No, 0 |
| Novelty (N) sub-metric score = Σ ‘yes’, ‘no’ scores | N = 50 |
| Visual richness (VR) metric score = 0.3 ∙ 50 + 0.2 ∙ 75 + 0.3 ∙ 50 + 0.2 ∙ 50 | VR= 55 |
Source: JRC.
Attractiveness of circulation at building scale (ACb) metric is evaluated by comparing the design solutions of the example building to the design characteristics related to the five elements of the architectural promenade composition, according to the sub-metrics in Table 112. Based on the comparison results, the example building includes the design solutions indicated in Table 121, thus the score of attractiveness of circulation at building scale is rated equal to 100.
Table 121. Example of attractiveness of circulation at building scale (ACb) metric evaluation.
| Sub-metric | Score |
The project includes the following design solutions related to the ‘form of the circulation space’ element: Form of the circulation space Differentiated proxemics are included in the building by considering the following distances: public (3.7 m to 7.6 m and more), social (1.2 m to 3.7 m) and personal (0.45 m to 1.2 m) (Hall, 1966): | |
The project includes the following design solutions related to the five elements of the architectural promenade and further features enhancing the user experience: Approach A spiral approach to the building, guided in a way that emphasises its three-dimensionality. Configuration of the path Nodal spaces that provide opportunities to stop, rest, change direction of movement. Path-space relationship The location/layout of the spaces determines the path modelling, and their relationship has been planned in such a way as to emphasise the functional or symbolic meaning of the particular interiors. Form of the circulation space The paths have an open form. Further features enhancing user experience The length of direct exposure of users to nature exceeds 50 % of the length of the entire promenade. The design of the promenade includes the concept of integrating architecture and art at least in the entrance spaces/zones. | 100 (Excellent) |
| ACb metric score = Selected sub-metric score | ACb = 100 |
Source: JRC.
Having evaluated the score for each metric, B.7.1 is estimated according to Equation (145), as reported in Table 122.
Table 122. Example of B.7.1 evaluation.
| Metric | VR | ACb |
| Metric score | 55 | 100 |
| B.7.1 score | = 0.5 ∙ 55 + 0.5 ∙ 100 = 77.5 | |
Source: JRC.
B.7.2 score is evaluated through the following three metrics: (i) tactile richness, (ii) auditory richness, and (iii) olfactory richness. Specifically, the three metrics are evaluated by comparing the design solutions of the example building with the ones indicated as reference to allow users to positively experience a project through their tactile, acoustic, and olfactory senses, according to the sub-metrics in Table 117, Table 118, and Table 119, respectively. Based on the comparison results, the example building includes the use of the design solutions reported in Table 123, thus leading to the tactile richness, auditory richness, and olfactory richness scores equal to 70, 40, and 70, respectively.
Table 123. Example of tactile richness (TR), auditory richness (AR), and olfactory richness (OR) metrics evaluation
| Tactile richness (TR) | |
| Sub-metric | Score |
The project includes the design solutions to attain the acceptable tactile richness and provides an advanced tactile experience through the use of the following additional design solutions: Intentional juxtaposition of flat surfaces (i.e. user-accessible floors, walls and partitions) with varying and contrasting textures (i.e. smooth-rough, bumpy-flat, hard-soft, warm-cold, slippery-sticky). Contact with natural finishes and decorative materials, greenery, and/or water provided to the users. | 70 (Good) |
| TR metric score = Selected sub-metric score | TR = 70 |
| Auditory richness (AR) | |
| Sub-metric | Score |
The project exceeds the low auditory richness by providing an acoustic experience through the following design solutions: Creation of spaces with varying sound intensity. Use of partitions and materials that muffle, absorb or diffuse sound. | 40 (Acceptable)
|
| AR metric score = Selected sub-metric score | AR = 40 |
| Olfactory richness (OR) | |
| Sub-metric | Score |
The project includes the design solutions to attain the acceptable olfactory richness and provides an advanced olfactory experience through the following additional design solutions: Intentional use of natural fragrant elements in the design, such as earth, water, greenery and flowers. | 70 (Good)
|
| OR metric score = Selected sub-metric score | OR = 70 |
Source: JRC.
Having evaluated the score for each metric, B.7.2 is estimated using Equation (149), as reported in Table 124.
Table 124. Example of B.7.2 evaluation.
| Metric | TR | AR | OR |
| Metric score | 70 | 40 | 70 |
| B.7.2 score | = 0.5 ∙ 70 + 0.3 ∙ 40 + 0.2 ∙ 70 = 61 | ||
Source: JRC.
B.7 score is estimated according to Equation (144) and it is found to be equal to 70.9, which corresponds to a Good performance class (according to Figure 79), as reported in Table 125.
Table 125. Example of B.7 evaluation.
| Indicator | B.7.1 | B.7.2 |
| Indicator score | 77.5 | 61 |
| B.7 score | = 0.6 ∙ 77.5 + 0.4 ∙ 61 = 70.9 | |
| B.7 performance class | Good | |
| B.7 performance class score (PCSB.7) | 70 | |
Source: JRC.
4.11 Providing spatial coherence in planning and design (B.8)
4.11.1 Description and assessment
Providing spatial coherence in planning and design (B.8) KPI refers to the overarching goal of ensuring a consistent integration of spatial transformations in the context of urban development through the creation of harmony, unity, and order (SFOC, 2021). The process of integration requires complex actions, such as maintaining a balance among buildings, green spaces, and infrastructures, while respecting local identity and architectural principles. Additionally, revitalising and/or remediating industrial sites and contaminated land represents an opportunity for the sustainable urban development and reduces pressure on undisturbed land resources, thereby further enhancing spatial coherence and urban cohesion.
Providing spatial coherence in planning and design (B.8) KPI is evaluated through the following three indicators:
- Spatial coherence and urban cohesion (B.8.1).
- Re-use of spaces and buildings (B.8.2).
- Green urban areas (B.8.3).
B.8 and its three associated indicators result into scores ranging between 0 and 100; specifically, B.8 score is calculated according to Equation (150).
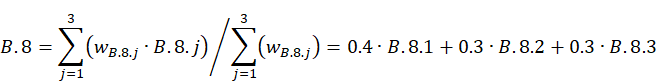
(150)
Figure 91 provides B.8 performance classes and thresholds adopted in the self-assessment method. Hence, the four ranges of B.8 scores equal to 0 ≤ B.8 < 25, 25 < B.8 ≤ 60, 60 < B.8 ≤ 80, and 80≤ B.8 ≤ 100 correspond to Low, Acceptable, Good, and Excellent performance class, respectively. While B.8 aspirational scores to attain the Good or the Excellent performance class remain desirable, it is highly recommended to reach at least an Acceptable performance class to maintain consistency with overarching urban development and sustainability objectives. This is particularly relevant in the situations where the official regulatory framework for spatial coherence is not available or not fully comprehensive.
Figure 91. B.8 performance classes and thresholds.

Source: JRC.
The KPI B.8 and its corresponding indicators can be applied at building, neighbourhood, and urban scale, considering both newbuild and renovation projects with residential and non-residential use, according to the conditions in the following.
At building scale, B.8.1, B.8.2, and B.8.3 indicators can be implemented for new buildings (newbuild projects) and buildings undergoing reconstruction (renovation projects), including external spaces situated within the parcel's confines (this is particularly significant for B.8.3, which refers to green areas). However, B.8.2 indicator applies to newbuild projects, only if the project is planned on a brownfield site.
At neighbourhood and urban scale, all indicators can also be applied to a distinct neighbourhood within the urban context (e.g. projects focused on revitalizing existing neighbourhoods, often involving the redevelopment of underutilized spaces, with significant changes to the original characteristics of the buildings or projects involving the creation of new neighbourhood areas, possibly on greenfield sites, with a mix of residential, commercial, and recreational spaces) or to large-scale urban development and redevelopment projects.
4.11.2 Spatial coherence and urban cohesion (B.8.1)
Spatial coherence and urban cohesion (B.8.1) indicator focuses on the concept of spatial coherence (planning and design) that concerns the physical aspect of spatial transformation interventions, and relates to their actual level of integration into the urban patterns. It entails a consideration of the way a project correlates with the surrounding urban grain, mostly attaining to spatial/urban morphology aspects at the neighbourhood and urban scale. The urban grain represents the physical layout and spatial configuration of a locality, shaped by historical development and cultural heritage, in which coherence (a clear definition of coherence is provided in ‘List of abbreviation and definition’ section) emerges as the fundamental prerequisite for spatial quality within the urban fabric (Çalişkan and Mashhoodi, 2017).
B.8.1 indicator assesses the degree of integration of a project within its respective environment. Any intervention should be undertaken with a thorough understanding and awareness of the existing place and its context at the relevant scale, from individual buildings to broader neighbourhood or urban scales. In addition to essential form-based (normative) concepts in urban design referring to principles and regulations that guide the physical form of urban environments (e.g. density, compactness, continuity, connectivity, etc.), B.8.1 indicator takes into account material, typological, and aesthetic concepts, as well as function-related aspects (SFOC, 2021). B.8.1 aims to provide an understanding of the extent to which a project fits adequately into its context, highlighting the importance of harmonising architectural elements, preserving open spaces, and ensuring compatibility with the surrounding setting for a sustainable and integrated urban growth.
B.8.1 indicator is evaluated through the following five metrics, relying on the 'visual order' concept, which emerges from the 'consistency and complementarity in the scale, character, and arrangement of buildings, setbacks, street furniture, and landscaping' (Ewing and Clemente, 2013), thus leading to a precise assessment of spatial quality:
- Scale and proportion (SP).
- Open space connectivity (OSC).
- Density compatibility (DC).
- Integration with surroundings (IS).
- Coherence with local spatial and strategic planning (CP).
B.8.1 score is evaluated as the weighted average of the aforementioned five metric scores (expressed as percentages), multiplied by 100 to obtain a dimensionless score ranging from 0 to 100, according to Equation (151).
(151)
Specificity of B.8.1 indicator lies in the fact that most of its e metrics require a comparison of the project scale to be assessed with the area of common characteristics at a higher scale. Specifically, in the case of a new building project, a comparison with the neighbourhood scale needs to be considered, and in the case of a newbuild neighbourhood project, a comparison with the urban scale (e.g. a city district or the entire city, depending on the size of the city, based on own estimates) needs to be taken into account. Furthermore, the most adequate way to define the boundaries of the neighbourhood needs to be identified by the users while proceeding with the self-assessment of a project. Boundaries can be established at a statistical-administrative level, or they can be based on protective measures, encompassing contact zones, historic urban landscapes or on functional or spatial considerations (including natural and geographic features).
Scale and Proportion (SP) metric evaluates the dimensions and proportions of buildings, aiming to ensure their consistency with the existing urban context. By promoting a coherent and aesthetically balanced built environment, this metric enhances the overall visual quality of the built landscape.
The SP score is based on the assessment of the average height of a building(s) located in the project designated area, as well as in the surrounding neighbourhood or urban area depending on the boundaries defined by the assessor to evaluate a building or neighbourhood scale project, respectively. Specifically, the SP score is calculated according to the scale and proportion deviation (SPdeviation) sub-metric, which depends on the scale and proportion ratio (SPratio) The SPratiois evaluated as the ratio of the average height of a building(s) within the project designated area to the average height of the buildings within the surrounding neighbourhood/urban area, expressed as a percentage, according to Equation (152).
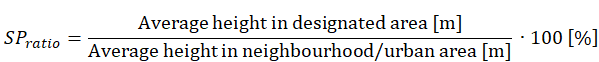
(152)
The SPdeviation sub-metric relies on a maximum baseline score equal to 100 % and is evaluated as the difference in absolute value between the SPratio sub-metric score and 100 %, according to Equation (153). This means that the specific deviation from 100 % itself is disregarded, whether negative or positive, while the focus is solely on its absolute value to record the percentage above or below 100 %.
(153)
The SP score is then evaluated as the difference in absolute value between 100 % and the SPdeviationsub-metric score, expressed as a percentage, to obtain a score within the range of 0 to 100 %, according to Equation (154). This approach allows for quantifying and evaluating the degree of conformity in building heights between a designated area and its surrounding context. Higher scores of the SP metric denote a greater degree of similarity in terms of scale and proportion between the designated area and its surroundings.
(154)
Open Space Connectivity (OSC) metric promotes a well-connected and integrated urban fabric by examining the relationships among various open spaces. Indeed, the spatial coherence also concerns the creation of human-scale spaces that are conducive to human activities, fostering a sense of community and connection, through a design that encourages social interaction and pedestrian-friendly environments (Gehl, 2010). The OSC metric assesses the project efficacy in preserving and linking accessible open areas and spaces within the urban context.
The OSC score is evaluated as the ratio of the number of open spaces extending beyond the project designated area to the total number of open spaces at the boundaries, expressed as a percentage, according to Equation (155). Specifically, in Equation (155), the No of OS extending beyond the project designated area refers to the number of areas not built upon or covered by buildings, also including parks, gardens, squares, or any undeveloped land, that extend beyond the boundaries of the project designated area, and the Total No of OS at the boundaries represents the total amount of open spaces at the boundaries of the project designated area.

(155)
The density compatibility (DC) metric addresses growth management issues, such as urban sprawl, growth patterns, and phasing of developments that heavily influencing urban form. To overcome these issues, the DC metric focuses on one of the main policy tools for urban planning represented by the control of the floor area ratio (FAR) (ESMAP, 2014). The DC metric evaluates whether a project aligns with the density standards of the surrounding area ensuring that the density of buildings and structures fits within the context of the neighbourhood/urban area. The DC metric relies on the evaluation of the building(s) area in relation to the area of the project site it occupies, by comparing the project FAR with the fraction of the surrounding area. In general, the project FAR is expressed as the total floor area of a building(s) in relation to the area of the project site on which it is built, according to Equation (156).
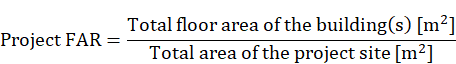
(156)
The DC score relies on the project FAR deviation (project FARdeviation) sub-metric, which depends on the project FAR ratio (project FARratio). The project FARratio is calculated as the ratio of the project FAR to the FAR in the neighbourhood/urban area, expressed as a percentage, according to Equation (157). To encourage a cohesive urban development, it is preferable that the density of new buildings closely align with the existing buildings in the surrounding area (Heymans et al., 2019). Ideally, the project FAR should be proportionate to the neighbourhood/urban area FAR. This indicates a balanced integration of the new development within the established urban fabric, promoting coherence and continuity in the overall built environment.
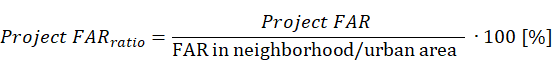
(157)
The project FARdeviation sub-metric relies on a maximum baseline score equal to 100 % and is evaluated as the difference in absolute value between the project FARratio score and 100 %, according to Equation (158). This means that the specific deviation is disregarded from 100 % itself, whether negative or positive, while the focus is solely on its absolute value to record the percentage above or below 100 %.
![]()
![]()
(158)
The DC score is evaluated consequently as the difference in absolute value between 100 % and the project FARdeviationsub-metric score, expressed as a percentage, to obtain a score within the range from 0 to 100 %, according to Equation (159). Higher scores of the DC metric denote a greater degree of similarity between the project designated area and its surroundings.
(159)
Integration with surroundings (IS) metric evaluates the extent to which a project interacts adequately with its surrounding environment, including open landscapes and urban fabric. Various factors, such as colour, materials, and architectural design, are considered to ensure a seamless integration with the surroundings, emphasising the visual and aesthetic coherence. According to Fainstein and DeFilippis (2015), understanding and preserving the urban grain are essential aspects for maintaining the unique identity and character of a city. Materials are also crucial in regard to the integration with surroundings, as they can evoke emotional responses and create a sense of place, while resonating with the local context, climate, and cultural identity (Broadbent, 1990).
The IS score is evaluated through three sub-metrics, i.e. visual harmony and spatial relationships, transitional fluidity, and aesthetic coherence, that are evaluated through visual assessment analyses and rely on the 'visual order' concept, which emerges from the consistency and complementarity in the scale, character, and arrangement of buildings, setbacks, street furniture, and landscaping (Ewing and Clemente, 2013). This visual order ensures that all elements of a project work together to create a unified and aesthetically pleasing environment.
Visual harmony and spatial relationships sub-metric evaluates how well the layout and arrangement of built elements fit within the natural contours, elevations, and features of the landscape, whether the design maintains or enhances important views and sightlines, allowing for visual continuity and a sense of connection with the natural surroundings.
Transitional fluidity sub-metric measures how effectively the design facilitates a transition between the built environment and the open landscape. It focuses on two main aspects: (i) the gradual transition, intended as the presence of intermediary spaces or elements (e.g. terraces, patios, or gardens) that soften the boundary between the indoor and outdoor areas, and (ii) the accessibility indicating how easily people can move between the built environment and the open landscape, depending on pathways, doorways, and the overall flow.
Aesthetic coherence sub-metric evaluates how well the project respects and integrates with the historical context and spatial design of the neighbourhood/urban area, thus assessing how complementary the project architectural composition, typology, and materiality are with the surrounding buildings, ensuring visual harmony and cohesiveness.
The IS score is evaluated through the aforementioned three sub-metrics to which assign a rate based on a scale of points (i.e. 0 to 5), depending on the absence/presence and relevance degree of their specific features (based on the sub-metric definitions above) within a project design, according to the rationale in
Table 126.
Table 126. Integration with surroundings (IS) metric score.
| Sub-metric | Score (points) |
| Rate each sub-metric below according to a scale of points (0-5, where 0 corresponds to absence of features, 1 to very weak, 2 to weak, 3 to moderate, 4 to strong, and 5 to very strong presence of features) and sum the three scores. | |
| Visual harmony and spatial relationships: evaluate whether and how the project design complements the natural features of the open landscape | 0 to + 5 |
| Transitional fluidity: evaluate whether and how the project design facilitates a seamless transition between the built environment and the open landscape | 0 to + 5 |
| Aesthetic coherence: evaluate whether and how the project design complements the architectural styles of neighbouring/urban area structures | 0 to + 5 |
| Integration with surroundings (IS) metric score = Σ sub-metric scores | 0 ≤ IS ≤ 15 |
Source: JRC.
The IS score, expressed in points, needs to be transformed into a score, expressed as a percentage, ranging from 0 to 100 %, thus the IS final score is evaluated as the ratio of the number of points awarded to the maximum possible number of points (i.e. 15), expressed as a percentage, according to Equation (160).
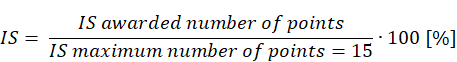
(160)
The IS final score indicates different degrees of the perceived integration of a project with surroundings, according to the following score ranges:
- The IS score ranging between 0 % and 20 % corresponds to a very weak perceived integration with surroundings (i.e. the project exhibits minimal to no discernible integration with its surroundings).
- The IS score ranging between 21% and 40% indicates a weak perceived integration with surroundings (i.e. project integration is below average, with notable deficiencies in criteria).
- The IS score ranging between 41 % and 60% corresponds to a moderate perceived integration with surroundings (i.e. the project demonstrates moderate integration with its surroundings, meeting basic criteria in most aspects).
- The IS score ranging between 61 % and 80 % is associated with a strong perceived integration with surroundings (i.e. the project integration with its surroundings is above-average, with positive performance in criteria, some refinements could further enhance the overall integration).
- The IS score ranging between 81 % and 100 % indicates a very strong integration with surroundings (i.e. the project exhibits overall integration and coherence with its surroundings in assessed criteria).
The coherence with local spatial and strategic planning (CP) metric relies on the coherence with local and regional policy and planning framework, thus referring to the alignment, synergy, and integration of spatial transformations with the policy and planning efforts (Couch et al., 2014). The CP metric assesses a project alignment and coherence with local spatial plans and broader strategic objectives, thus evaluating whether the project both contributes to informed decision-making, sustainable development practise and positively influences the overall development strategy of its designated area. The local spatial (i.e. land use) and strategic plans represent key actions that reflect the core values of urban stakeholders and demonstrate the functionality of the urban system the project is developed.
The CP score indicates the project compliance with relevant local spatial and strategic plans, evaluated as the ratio of the number of key priorities within these plans the project is aligned with to the total number of key priorities identified within these plans, expressed as a percentage, according to Equation (161).
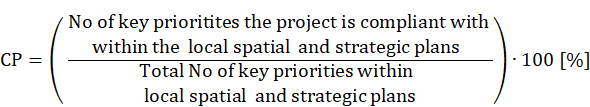
(161)
Figure 92 shows the indicator thresholds used to associate indicator scores to performance classes for B.8.1. While these thresholds and performance classes are not directly applied in the evaluation of KPI and dimension scores and performance classes, they are included here to assist users in determining appropriate performance levels for specific project aspects and to offer clear guidance on their improvement. Specifically, the Low performance class indicates significant shortcomings and metrics needing urgent improvement, the Acceptable one indicates moderate performance with potential for enhancement. The Good one demonstrates commendable performance with room for improvement, and the Excellent one indicates outstanding performance across all metrics.
Figure 92. B.8.1 indicative performance classes and thresholds.

Source: JRC.
B.8.1 score can be increased by enhancing the open space connectivity and elevating green infrastructure with the inclusion of small public parks and green corridors throughout the project to form a cohesive network of interconnected open spaces. The project design should prioritise interconnected pathways, visual continuity, and multifunctional green areas to encourage a sense of community, recreational opportunities, and environmental resilience (Bolund and Hunhammar, 1999, Pickett et al., 2001, Brussard and Pearlmutter, 2015). Other measures to improve B.8.1 score concern the improvement of the design that responds to complementarity with architectural composition, typology and materiality of neighbouring to also enhance the aesthetics coherence. Different configurations and massing options should be also explored to develop a design that incorporates stepped building heights. Furthermore, coherence with local spatial and strategic planning needs to be ensured, by conducting a detailed review of the existing local spatial and strategic plans relevant to the project area to align the project objectives with the key priorities identified by these plans. Finally, the proposed project development should contribute positively to the overarching goals of the community.
4.11.3 Re-use of spaces and buildings (B.8.2)
The Reuse of spaces and buildings (B.8.2) indicator assesses the extent to which existing buildings and spaces are reused or adapted for new purposes, thus proceeding with renovation projects and/or remediation of contaminated (i.e. dismissed industrial areas) or underutilised areas for newbuild projects, instead of using unsealed land, according to the paradigm of the no net land take (COM, 2021). The indicator evaluates the practice of reusing space as an effective strategy to reduce urban sprawl and its associated environmental impacts while promoting the vitality and occupancy of neighbourhoods. The indicator recognises the importance of addressing areas in transition and/or deindustrialization, as the particular attention to these areas reflects a commitment to revitalising urban landscapes and promoting economic resilience, while improving the environmental performance of buildings and infrastructures in their entire life cycle (ESPON, 2020).
In general, B.8.2 indicator is evaluated through the following two metrics:
- Re-development of contaminated area (RCA).
- Re-development of functionally devalued areas (RDA).
At building scale, B.8.2 indicator can be applied to newbuild projects only if the project to be self-assessed is carried out on a brownfield site. Thus, in case of a new building project on a greenfield side B.8.1 is omitted from B.8 evaluation.
B.8.2 score, ranging from 0 to 100, is calculated as the weighted average of the aforementioned two metric scores (expressed as percentages), to be multiplied by 100, according to Equation (162). However, the RCA metric can be applied exclusively in case of projects concerning contaminated areas (i.e. industrial areas), thus B.8.2 score evaluation for projects within non-contaminated areas relies exclusively on the re-development of functionally devalued areas metric, thus RCA metric is omitted, according to Equation (163).
(162)
(163)
The re-development of contaminated areas (RCA) metric assesses the extent to which pollution has been removed and activities have been undertaken to remediate and revitalise contaminated sites. It evaluates efforts to address contamination and restore the designated areas to a safe and usable condition.
RDA score evaluates the re-developed area in square meters (m²), expressed as a percentage of the total contaminated area, according to Equation (164). RCA score represents the proportion of contaminated area that has undergone re-development or remediation efforts. The higher the score, the greater the level of successful re-development or remediation in relation to the total contaminated area.
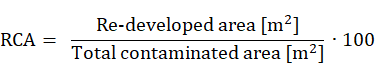
(164)
Re‑development of functionally devalued areas (RDA) metric evaluates the extent to which functionally devalued spaces within a given area have been revitalised and transformed to serve new and improved purposes. Functionally devalued areas refer to spaces within a built environment that have lost their original purpose or functionality, often due to neglect, deterioration, or changes in urban needs. These areas may include abandoned buildings, underutilised infrastructure, or not adequately maintained public spaces. RDA examines efforts to repurpose and enhance these areas, ensuring positive contribution to the overall quality and functionality of the environment.
The RDA score evaluates the re-developed area in square meters (m²), and expresses it as a percentage of the total functionally devaluated area (m²), according to Equation (165). RDA score represents the proportion of functionally devalued area that has undergone re-development efforts. The higher the score, the greater the level of successful re-development in relation to the total devalued area.
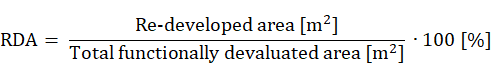
(165)
Figure 93 shows the indicator thresholds used to associate indicator scores to performance classes for B.8.2. While these thresholds and performance classes are not directly applied in the evaluation of KPI and dimension scores and performance classes, they are included here to assist users in determining appropriate performance levels for specific project aspects and to offer clear guidance on their improvement. The indicator score ranges, linked to the indicator performance class, categorise the overall re-use efforts into different levels of effective reused areas of spaces and buildings and elements relative to the total. Higher scores, corresponding to Good or Excellent performance classes, indicate a more comprehensive and successful re-use of the buildings, neighbourhoods and urban areas, while lower scores, corresponding to Low or Acceptable performance classes, suggest a lesser degree of re-use of buildings and areas.
Figure 93. B.8.2 indicative performance classes and thresholds.

Source: JRC.
B.8.2 score can be enhanced by considering a comprehensive renovation project dealing with a thorough assessment of building infrastructures and systems to identify areas in need of renovation and invest in both upgrading utilities, HVAC systems and retrofitting structural components. Other measures regard solid renovation strategies focused on both the implementation of remediation strategies to effectively remove contamination and the use of advanced technologies, such as soil vapour extraction, bioremediation or chemical oxidation, to treat contaminants and restore the environmental quality.
4.11.4 Green urban areas (B.8.3)
Nature-based solutions, encompassing green infrastructure and ecosystem-based approaches, are fundamental to spatial coherence in landscape design for climate resilience. Spatial coherence in the green spaces design also involves integration of small-scale site planting within existing built environments (Klemm and McDonnell, 2013).
Based on the above, green urban areas (B.8.3) indicator determines whether a project integrates easily accessible green areas and preserve and improve the quality of the place. The indicator also assesses whether a project is improved through dedicated solutions, such as promotion of spatial interventions that incorporate elements of the landscape, its vegetation and patterns, integration of existing natural features, and inclusion of new natural features in a multifunctional network that supports site quality and biodiversity.
B.8.3 indicator is evaluated through the three following metrics:
- Increased areas under canopy cover (IC).
- Green infrastructure integration (GI).
- Biodiversity enhancement (BE).
B.8.3 score is calculated as the weighted average of the aforementioned three metric scores (expressed as percentages), multiplied by 100 to obtain a dimensionless score, ranging from 0 to 100, according to Equation (166).
(166)
The increased areas under canopy cover (IC) metric evaluates the extent to which outdoor spaces within a building, neighbourhood, or urban scale project are covered by canopy or vegetation, underscoring the importance of integrating green infrastructure into urban developments to enhance environmental sustainability, improve air quality, mitigate urban heat island effects, and promote biodiversity. IC score estimates the area of outdoor spaces covered by canopy or vegetation within a project, expressed as a percentage of the total outdoor area, according to Equation (167).
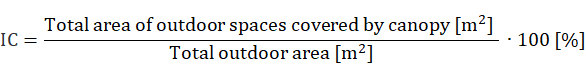
(167)
Green infrastructure integration (GI) metric, also indicated as increased soil permeability, assesses the extent to which a project incorporates permeable soil surfaces within its exterior spaces, with the aim to mitigate issues related to urbanisation, such as storm water runoff, flooding, and soil erosion. The metric evaluates the degree of soil permeability within the project area, reflecting the project commitment to integrating green infrastructure and promoting sustainable land use practices. GI score evaluates the increased soil permeability by estimating the total area of permeable surfaces (i.e. unsealed soil), expressed as a percentage of area of unsealed soil in the total area of exterior spaces according to Equation (168).
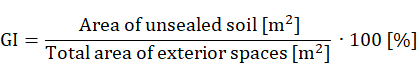
(168)
The biodiversity enhancement (BE) metric assesses the effectiveness of biodiversity enhancement efforts within a project, aiming to quantify the introduction or promotion of native plants species, as well as to measure the increase in abundance or population size of native species. BE metric counts the total number of plant species that have been intentionally introduced or reintroduced into the project area. After collecting data on the abundance or population size of native species within the project area before and after biodiversity enhancement interventions, BE score estimates the introduction or increase of the post-intervention abundance (or population size), expressed as a percentage, compared to the pre-intervention abundance, according to Equation (169). However, BE maximum score cannot exceed 100 %.

(169)
In Equation (169), post‑intervention abundance indicates the total number of plant species within the project area after the biodiversity enhancement intervention, thus including the species that have been intentionally introduced or reintroduced into the project area plus the existing ones, and pre‑intervention abundance refers to the number of plant species within the project area before the biodiversity enhancement intervention.
Figure 94 shows the indicator thresholds used to associate indicator scores to performance classes for B.8.3. While these thresholds and performance classes are not directly applied in the evaluation of KPI and dimension scores and performance classes, they are included here to assist users in determining appropriate performance levels for specific project aspects and to offer clear guidance on their improvement. Specifically, the Low performance class suggests significant shortcomings and the need for immediate attention and improvement of B.8.3 score, the Acceptable one indicates moderate performance with room for improvement, the Good one demonstrates a commendable level of achievement, and the Excellent one represents an exceptional performance across all metrics.
Figure 94. B.8.3 indicative indicator performance classes and thresholds.

Source: JRC.
B.8.3 can achieve an higher score by increasing the areas under canopy cover and the density of vegetation by planting additional trees, shrubs, and greenery throughout outdoor spaces, and incorporating vertical greening elements, such as living walls and vertical gardens to maximise canopy cover within constrained areas. Other solutions concern the green infrastructure integration to increase soil permeability. Specifically, the proportion of permeable surfaces can be increased by retrofitting existing hardscaped areas with permeable pavement, gravel pathways, and porous materials. Bioswales and rain gardens can be implemented to capture and filter storm water runoff, improve soil permeability and enhance water quality. Moreover, natural drainage features, such as swales and berms, can be incorporated to direct rainwater into vegetated areas and promote infiltration. Further suggestions concern the biodiversity enhancement by expanding the variety of native plant species into the project area to create a diverse and resilient ecosystem that support a wide range of wildlife. Habitat restoration initiatives, such as the creation of wetlands, meadows, and wildlife corridors, can also be implemented to provide critical habitats for native species.
4.11.5 Example (B.8)
The example refers to a renovation project aimed to transform a mixed-use neighbourhood, accounting for a surface (project site) equal to 4000 m2, within a larger urban area into an ecologically sustainable and cohesive environment. Focusing on sustainability aspects, the project integrates various initiatives to enhance the neighbourhood infrastructure, increase cohesion, and introduce green spaces into a high-density environment. Starting with a brownfield redevelopment project, the urban planning aim to repurpose a former industrial building on a contaminated site. Environmental engineers will conduct assessments and soil testing to determine the extent of contamination. The project objective is to remediate the site, renovate the existing building, and convert it into a mixed-use space with commercial and residential units. Simultaneously, the project also envisions the creation of a new green city block, connecting major streets. Street façades will be restrained, while greened buildings, a promenade, and a park will be developed within the block. The project will feature various residential typologies alongside green environments and a vertical park. A variety of plants will be integrated throughout the site and building floors, supported by an irrigation and drainage system. Sustainability of the greenery will be ensured through a detailed horticultural project, with plant maintenance being the responsibility of the joint maintenance service of the city block.
The project is classified as a neighbourhood and renovation project according to scale and type, respectively, whereas the residential use is considered as it is identified as the main use of the project (please note that B.8 score evaluation is not affected by the project main use).
The evaluation of B.8 depends on the scores of B.8.1, B.8.2, and B.8.3 indicators, thus their estimation was first carried out.
B.8.1 score is evaluated through the following five metrics: (i) scale and proportion, (ii) open space connectivity, (iii) density compatibility, (iv) integration with the surroundings, and (v) coherence with local spatial and strategic plans.
Scale and proportion (SP) metric is evaluated following the estimation of the SPdeviation sub-metric score that relies on the SPratio score. The SPratio score evaluation is based on the assumption that existing buildings with the following heights: 60 m, 53 m, 50 m, 55 m, 57 m, and 55 m[1], are located in the designated area of the neighbourhood scale project. Hence, the average height of buildings in the designated area is estimated equal to 55 m. In order to define the broader urban area delimitation to which the designated area of the neighbourhood scale project needs to be compared to, the existing boundaries established at the statistical-administrative level were chosen, since the characteristics of the project largely coincide with the characteristics of the buildings located within the city district (administrative division) of above-mentioned scope. The average height of all buildings in the surrounding neighbourhood area (i.e. city district area) is 35 m. Based on these data, the SPratio score is estimated equal to 160 %, using Equation (154), as reported in Equation (170).
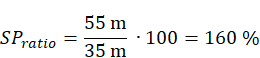 |
(170)
The SPdeviation sub-metric score is evaluated using Equation (153) and it is found to be equal to an absolute value of 60 %, as reported in Equation (171).
(171)
The SP score is evaluated using Equation (154) and it is estimated equal to 40 %, as reported in Equation (172), pointing out the level of scale and proportion of the project in the designated area compared to the surrounding neighbourhood considered as boundaries. The SP score suggests that the scale and proportion of the buildings in the designated area are partially aligned with the ones in the surrounding neighbourhood. However, the SPratio score indicates that the buildings in the designated area are taller on average, potentially affecting the visual coherence of the urban landscape.
(172)
Open space connectivity (OSC) metric is evaluated based on the following two sub-metrics: (i) the number of open spaces extending beyond the project designated area is equal to 12 (including small parks, community gardens, pedestrian walkways, public squares, etc.), while (ii) the total number of open spaces at the boundaries of the project designated area is equal to 15. From the Equation (155), the OSC score is estimated equal to 80 %, as reported in Equation (173).
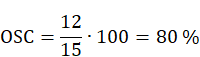 |
(173)
The OSC score points out that 80 % of the open spaces extend beyond the project area boundaries. This high percentage suggests strong connectivity between the project open spaces and the ones located in the surrounding areas, indicating that the project open spaces are well-integrated with the broader urban environment, facilitating movement and accessibility throughout the neighbourhood. This high connectivity fosters a sense of continuity and coherence in the urban landscape, promoting pedestrian flow and community engagement across different areas of the neighbourhood.
Density compatibility (DC) metric is evaluated following the estimation of the project FARdeviation sub-metric score that relies on the project FARratio score. To evaluate the project FARratio score, the following data needed to first estimate the project FAR are considered: the total floor area of the buildings within the designated project area is equal to 12000 m2and the total area of the project site is equal to 4000 m2. Hence, the project FAR score is calculated using Equation (156) and resulting into a value equal to 3, as estimated through Equation (174).
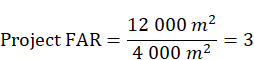
(174)
The FAR in the city district area is equal to 2; therefore, the project FARratio score is evaluated using Equation (157), resulting equal to 150 %, as reported in Equation (175).
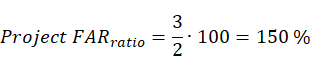
(175)
The project FARdeviation sub-metric score is evaluated using Equation (158) and it is found to be equal to an absolute value of 50 %, as reported in Equation (176).
(176)
The DC score is evaluated using Equation (159) and it is found to be equal to 50 %, as reported in Equation (177), indicating a medium level of compliance in terms of density with the surrounding area.
(177)
The integration with surroundings (IS) metric is first evaluated in points based on the absence/presence and degree of relevance of the specific features related to the three sub-metrics, i.e. visual harmony and spatial relationship, transitional fluidity, and aesthetic coherence, within the project (
Table 126), as reported in the following, leading to the IS score in points equal to 12 (out of 15), as reported in
Table 127.
Visual harmony and spatial relationships - The project design effectively integrates with the natural features of the open landscape, ensuring visual harmony and the incorporation of green spaces with a high-density environment enhances the overall aesthetic appeal.
Transitional fluidity - The project design prioritises fluidity, providing a transition between the built environment and the open landscape; walkways, green corridors, and thoughtful design contribute to integrated space.
Aesthetic coherence - The project design is in harmony with neighbouring structures, as the project not only complements but also brings additional value to the aesthetic coherence of the area, contributing positively to the overall visual identity of the neighbourhood.
Table 127. Example of integration with surroundings (IS) evaluation.
| Sub-metric | Score (points) |
| Rate each sub-metric below according to a scale of points (0-5, where 0 corresponds to absence of feature, 1 to very weak, 2 to weak, 3 to moderate, 4 to strong, and 5 to very strong presence of features) and sum the three scores. | |
| Visual harmony and spatial relationships: evaluate how the project design complements the natural features of the open landscape. | + 4 (strong) |
| Transitional fluidity: evaluate how the project design facilitates a seamless transition between the built environment and the open landscape. | + 3 (moderate) |
| Aesthetic coherence: evaluate how the project design complements the architectural styles of neighbouring/urban area structures. | + 5 (very strong) |
| Integration with surroundings (IS) metric score = Σ sub-metric scores | IS = 12 |
Source: JRC.
The IS score, expressed in points, is transformed into the IS final score by using Equation (160), thus estimating equal to 80 %, as provided through Equation (178). According to score ranges corresponding to different degree of the perceived integration (Section 4.11.2), the IS score indicates a strong perceived integration of the project with its surroundings, suggesting that the project exhibits above-average integration with positive performance in most criteria.
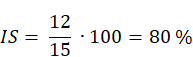 |
(178)
Coherence with local spatial and strategic planning metric is evaluated based on the following aspects. A local spatial planning document along with a strategic plan outlining the city development initiatives is provided at community level. Five key priorities were identified within this plan: (i) sustainable infrastructure development ensuring that the project is consistent with plans for sustainable infrastructure development, such as energy efficient utilities and green technologies; (ii) mixed land use to comply with zoning regulations to encourage mixed-use areas to promote a mix of residential, commercial and recreational areas; (iii) preservation of green space to prioritise the preservation of green space and ensure that the project unions well with existing parks or integrates new green space; (iv) affordable housing: coordinating with affordable housing plans to meet the diverse housing needs of the community, and (v) transit-oriented development: adherence to strategies to promote transit-oriented development, improving accessibility, and reducing reliance on private vehicles. The project aligns with all the five key priorities identified by the local spatial and strategic plan, as it includes sustainable infrastructure, mixed-use zoning, green space preservation, affordable housing, and transit-oriented development. Hence, the CP score is estimated using Equation (161) and resulting into a value equal to 100 % that indicates a very strong level of coherence with the local spatial (i.e. land use) and strategic plans, as reported through Equation (160).
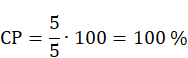
(179)
Having evaluated the score of each metric, B.8.1 score is calculated according to Equation (151), resulting into a value equal to 70, corresponding to the indicative Good performance class (Figure 92. B.8.1 indicative performance classes and thresholds), as reported in Table 128. The project exhibits commendable connectivity with its surroundings and coherence with planning documents, although it does not fully meet scale and proportion, as well as density compatibility standards. However, the project excels in aligning with local planning priorities and demonstrates cohesive integration with its surroundings, indicating a high level of overall coherence.
Table 128. Example of B.8.1 evaluation.
| Metric | SP | OSC | DC | IS | CP |
| Metric score | 40 % | 80 % | 50 % | 80 % | 100 % |
| B.8.1 score | = (0.2 ∙ 40 % + 0.2 ∙ 80 % + 0.2 ∙ 50 % + 0.2 ∙ 80 % + 0.2 ∙ 100 %) ∙ 100 = 70 | ||||
| B.8.1 performance class | (Good)1 | ||||
1 Transformation of the indicator score to an indicator performance class is indicative and not required by the self-assessment method to estimate KPI and dimension scores and performance classes.
Source: JRC.
B.8.2 score is evaluated through the following two metrics: (i) re‑development of contaminated areas and (ii) re‑development of functionally devalued areas. In case a project involves a brownfield area without contamination, only the redevelopment of functionally devalued areas metric is considered. In the proposed example a total area equal to 1000 m2 within the project site area was found to be contaminated, thus both metrics applies to the example.
Re‑development of contaminated areas (RCA) metric is estimated based on the assumption that remediation strategies of the contaminated area, such as soil excavation to reduce the risks of contamination, were carried out by specialists. Following these works, an area equal to 800 m2 out of the total 1000 m2of the formerly contaminated area, was successfully remediated. Hence, RCA score is estimated using Equation (164) and results into a value equal to 80 %, according to Equation (180), which indicates a high percentage of the contaminated area within the building footprint successfully remediated.
(180)
Re−development of functionally devalued areas (RDA) metric is estimated based on the following sub-metrics. A total area equal to 1000 m2 was found to be functionally devalued, following the architects and urban planners’ assessment concerning the existing condition of the former industrial building to be renovated and the identification of functionally devalued spaces, such as deteriorating infrastructure and vacant spaces. Plans for renovating the building, improving the infrastructure and adapting the contemporary needs were developed leading to the successful transformation of an area equal to 900 m2 out of the total functionally devalued area of 1000 m2. Hence, RDA score is estimated using Equation (30) and results into a value equal to 90 %, as reported in equation (181), which indicates a very high percentage of the functionally devalued area within the building successfully re-developed through renovation efforts
|
(181)
Having evaluated the score of each metric, B.8.2 score is calculated according to Equation (162), resulting into a value equal to 84, corresponding to the indicative Excellent performance class (Figure 93), as reported in Table 129. The evaluation of B.8.2 emphasises the greater importance of remediating contaminated areas, while still recognising the significance of improving functionally devalued areas. B.8.2 score indicates a high level of success in revitalising both contaminated and functionally devalued areas within the project.
Table 129. Example of B.8.2 evaluation.
| Metric | RCA | RDA |
| Metric score | 80 % | 90 % |
| B.8.2 score | = (0.6 ∙ 80 % + 0.4 ∙ 90 %) ∙ 100 = 84 | |
| B.8.2 performance class | (Excellent) 1 | |
- 1 Transformation of the indicator score to an indicator performance class is indicative and not required by the self-assessment method to estimate KPI and dimension scores and performance classes.
Source: JRC.
B.8.3 score is evaluated through the three following metrics: (i) increased areas under canopy, (ii) green infrastructure integration, and (iii) biodiversity enhancement.
Increased areas under canopy (IC) cover metric is evaluated based on the assumption that the integration of trees, shrubs, and other vegetation in the outdoor spaces of the project is designed to increase canopy cover. Specifically, the plan foresees to cover by canopy an area equal to 500 m2 out of the total outdoor area of 1000 m2. Hence, the IC score is estimated using Equation (167) and results into a value equal to 50 %, as reported in Equation (182), indicating the percentage of the total outdoor area which will be covered by lush canopy, thus creating an oasis amidst the urban landscape.
 |
(182)
Green infrastructure integration (GI) metric is evaluated by relying on the assumption that the project provides for the incorporation of permeable surfaces, such as green roofs, permeable pavement, and landscaped areas to increase soil permeability. Specifically, the project foresees a total area of unsealed soil equal to 300 m2 out of a total area of exterior spaces of 1000 m2. Hence, the GI score is calculated using Equation (168) and results into a value equal to 30 %, according to Equation (183), indicating the percentage of exterior spaces ensured to be unsealed soil to increase soil permeability.
 |
(183)
Biodiversity enhancement metric is calculated based on the increase of native plants within the project area. With the introduction of 20 new plant species, there has been a notable increase in their total number, as only 10 plant species were present prior to the project development. Hence, the post-intervention abundance corresponds to a total number of 30 plant species, whereas the pre-intervention abundance is equal to 10. Based on these sub-metrics, BE score is estimated using Equation (169), resulting into a 200% increase in abundance compared to the original number of plant species. This initiative significantly enhances the ecological richness and resilience of the site. However, BE maximum score cannot exceed 100 %, thus the score is set equal to 100 %. By creating habitat diversity and supporting native flora and fauna, the project contributes to the overall health of urban ecosystems.
(184)
Having evaluated the score of each metric, B.8.3 score is calculated according to Equation (166)(151), resulting into a value equal to 59.9 %, corresponding to the indicative Good performance class (Figure 94), as reported in Table 130. The project demonstrates an overall integration of green areas, thus preserving and improving the quality of the place.
Table 130. Example of B.8.3 evaluation.
| Metric | IC | GI | BE |
| Metric score | 50 % | 30 % | 100 % |
| B.8.3 score | = (0. ∙ 50 % + 0. | ||
| B.8.3 Performance class | (Good)1 | ||
1 Transformation of the indicator score to an indicator performance class is indicative and not required by the self-assessment method to estimate KPI and dimension scores and performance classes.
Source: JRC.
Having evaluated the three indicators, B.8 score is estimated using Equation (150) and it is found to be equal to 71.1, which corresponds to the Acceptable performance class (according to Figure 91), as reported in Table 131. The B.8 performance class attained demonstrates that the project exhibits a good effort in enhancing spatial coherence, reusing spaces and buildings, and integrating green urban areas. While there are areas for improvement, the project shows promise in transforming the neighbourhood into a sustainable and cohesive urban environment.
Table 131. Example of B.8 evaluation.
| Indicator | B.8.1 | B.8.2 | B.8.3 |
| Indicator score | 70 | 84 | 59.9 |
| B.8 score | = 0.4 ∙ 70 + 0.3 ∙ 84 + 0.3 ∙ 59.9 = 71.1 | ||
| B.8 performance class | Good | ||
| B.8 performance class score (PCSB.8) | 70 | ||
Source: JRC.
[1] Data are provided solely for the purpose of clarifying the evaluation of the metric score and do not serve as benchmarks or standards.
4.12 Improving preservation of cultural and natural heritage (B.9)
4.12.1 Description and assessment
Improving preservation of cultural and natural heritage (B.9) KPI emphasises the importance of safeguarding and enhancing the protection of both cultural and natural assets for the benefit of present and future generations. Cultural heritage (a clear definition is provided in the List of abbreviations, symbols and definitions section) gives evidence of the many types of human activities, historic events and evolutions, artistic creations, social institutions and technical achievements. Natural heritage provides evidence of the diverse types of ecological processes, evolutionary developments, geological formations, biodiversity, and interactions between ecosystems. This goal involves a multi-sectoral approach aimed at ensuring the responsible project development, conservation and sustainable design of places, artefacts, ecosystems and landscapes of cultural and environmental significance. Uses of - and interventions on - cultural heritage must respect and keep the character of a place and its values. Maintaining authenticity and integrity (clear definitions are provided in the List of abbreviations, symbols and definitions section) is of great importance, even in cases of compatible and respectful re-use, so that future generations would continue to have access to the full richness of the existing heritage (SWD, 2019, Dimitrova et al., 2020). Natural and cultural heritage can contribute to, and are also crucial enablers of resilience, adaptation, and sustainable development. Through smart renovation and transformation, heritage sites can find new, mixed or extended uses. As a result, their social, environmental and economic value is increased, while their cultural significance is enhanced. However, conservation actions should preserve and reveal the aesthetic and historic value of a building/site (Council of Europe, 2021), based on respect for original materials and authentic documents. The valid contributions to a monument/cultural building from all historical periods should be recognised and respected. Replacements of missing parts should be integrated harmoniously with the whole, but at the same time must be distinguishable from the original, so that restoration does not falsify the artistic or historic evidence (ICOMOS, 1964). Cultural heritage is inherently interdependent, as it is continuously redefined through human activity, thus not being a static, unchanging entity, and emphasising the relationship to the spatial environment.
B.9 focusing on the enhancement and protection of cultural and natural heritage is assessed through the three following indicators, tailored to different contexts depending on statutory protection or not of the project to be assessed:
- Historical fabric preservation (B.9.1), which targets statutory protected historical environments, city landscapes, and heritage sites.
- Integrated heritage/natural landscape conservation (B.9.2), which applies to statutory protected natural landscape contexts.
- Improving preservation of cultural and natural heritage in renovated buildings (B.9.3), which addresses renovation projects that are not statutory protected, but have historical and cultural significance.
B.9 score, ranging from 0 to 100, is calculated differently depending on whether the evaluation refers to renovation projects of buildings/neighbourhoods with statutory protection, or without statutory protection but with historical and cultural value contributing to heritage preservation and revitalisation. Specifically, if a cultural and natural heritage project is statutory protected, B.9 score evaluation relies on B.9.1 and B.9.2 indicators (i.e. B.9.3 indicator is omitted), according to Equation (185). Conversely, if a cultural and natural heritage project is not statutory protected, B.9 score evaluation only depends from B.9.3 indicator (i.e. B.9.1 and B.9.2 indicators are omitted), according to Equation (186).
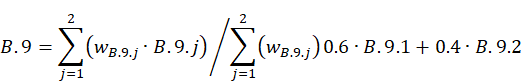
(185)
(186)
Figure 95 provides B.9 performance classes and thresholds adopted in the self-assessment method. Hence, the four ranges of B.9 scores, equal to 0 ≤ B.9 < 20, 20 ≤ B.9 < 50, 50 ≤ B.9 < 70, and 70 ≤ B.9 ≤ 100, are associated with the Low, Acceptable, Good and Excellent performance class, respectively. While B.9 scores to attain the Good or the Excellent performance class are greatly desirable, meeting the Acceptable performance class leastwise is highly recommended to ensure that the project at least contributes to the overall objective of respecting and preserving the character of heritage places and values.
Figure 95. B.9 performance classes and thresholds.

Source: JRC.
B.9 and its corresponding indicators are applicable exclusively to cultural heritage projects (i.e. B.9.1 and B.9.2 for statutory protected projects, and B.9.3 for non-statutory protected projects) at both building and neighbourhood scale, including exclusively renovation projects concerning both residential and non-residential use.
Specifically, at both building and neighbourhood scale, B.9.1 indicator can act as a guideline to ensure that restoration efforts align with the principles of historical fabric preservation, thus it can be applied for historic building restoration projects and/or cultural heritage building conservation, as well as conservation of historical/cultural heritage neighbourhoods. B.9.2 indicator can be applied to conservation or restoration planning for heritage sites that involves integrated approaches to landscapes, including efforts to protect or restore original design elements, plant species, and features that contribute to the historical character of the urban green spaces within the project. Hence, B.9.2 focuses on both building and neighbourhood renovation projects within a natural landscape or including natural spaces with historic significance (e.g. historic gardens, parks, green areas) undergoing revitalisation.
B.9.3 indicator is applied to renovation projects that focus on the restoration and preservation of historic buildings and neighbourhoods, that are not statutory protected (conversely to B.9.1 and B.9.2), but hold architectural and/or cultural value. Examples may include historic building renovation, adaptive reuse initiatives focusing on renovation projects that repurpose existing buildings for new uses while retaining their original character and architectural elements, neighbourhood re-development projects focused on revitalising neighbourhoods or districts, where preserving key architectural features and maintaining the area cultural identity is essential.
4.12.2 Historical fabric preservation (B.9.1)
The historical fabric preservation (B.9.1) indicator assesses the holistic preservation efforts within a heritage project to maintain the authentic character and visual integrity of historical structures and surroundings, encompassing the preservation of various aspects, such as patina, original structural elements and historical infrastructure materials, and chromatic traditions.
B.9.1 indicator that only applies to statutory protected cultural heritage is evaluated through the following four metrics:
- Preserved patina (PP).
- Preserved original/historic structural elements (PSE).
- Preserved original/historic openings (PO).
- Heritage value (HV).
B.9.1 score is calculated as the weighted average of the scores of the aforementioned four metrics (expressed as percentages), multiplied by 100 to obtain a dimensionless score ranging from 0 to 100, according to Equation (187).
(187)
Preserved patina (PP) metric serves as a tool to maintain history and the cultural diversities of buildings and neighbourhoods. It evaluates the extent to which existing materials and elements have been saved and cleaned to display their age or used appearance contributing to the preservation of the historical patina (a clear definition of patina is provided in the ‘List of abbreviations, symbols and definitions’ section).
PP score evaluates the ratio of the area of preserved patina, typically involving the building facades, in square meters (m²) to the total area of the external walls of a building in square meters (m²), expressed as a percentage, according to Equation (188).
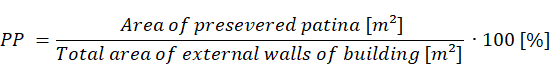
(188)
Preserved original/historic structural elements (PSE) metric deals with the conservation of original or historic structural elements of a building, including perimeter and inner structural walls, floors, and roofs. The metric evaluates the extent to which the original or historic structural elements are preserved, indicating the degree of conserving the historical integrity and authenticity of the structure.
PSE score is calculated as the ratio of the area of preserved original or historic structural elements (i.e. walls, floors, roofs) in square meters (m²) to the total floor area of the building in square meters (m²), expressed as a percentage, according to Equation (189).
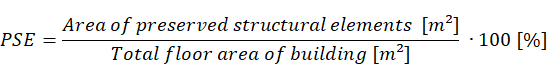
(189)
Preserved original/historic openings (PO) metric examines the preservation or replacement of original/historic openings, such as windows, shutters, and doors. Specifically, the metric evaluates the extent to which original or historic openings have been maintained, properly compared to the total number of openings, indicating the degree of preservation.
The PO score estimates the ratio of the number of preserved original or historic openings to the total number of openings, expressed as a percentage, according to Equation (190).
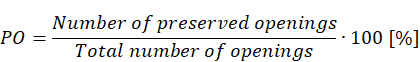
(190)
Heritage value (HV) metric assesses comprehensively a heritage site, considering its historical, aesthetic, and architectural attributes, which can be summarised in the following three sub-metrics, i.e. representativeness, ambient value, and architectural value.
The HV score is evaluated through the aforementioned three sub-metrics to which assign a rate based on a scale of points (i.e. 0 to 5), depending on the absence/presence and relevance degree of their specific features within a project, according to the rationale in Table 132.
Table 132. Heritage value assessment (HVA) metric score.
| Sub-metric | Score (points) |
| Rate each sub-metric below according to a scale of points (0-5, where 0 corresponds to absence of feature, 1 to very weak, 2 to weak, 3 to moderate, 4 to strong, and 5 to very strong presence of features) and sum the three scores | |
| Representativeness: evaluate how the heritage site represents a particular period, style, or cultural aspect? | 0 to + 5 |
| Ambient value: evaluate the heritage site environmental and aesthetic qualities, consider its natural surroundings, landscape, and overall atmosphere. | 0 to + 5 |
| Aesthetic coherence: evaluate the architectural significance, innovation, and craftsmanship of the buildings within the heritage site. | 0 to + 5 |
| Heritage value assessment (HVA) metric score = Σ sub-metric scores | 0 ≤ HVA ≤ 15 |
Source: JRC.
The HV score, expressed in points, needs to be transformed into a score, expressed as a percentage, ranging from 0 to 100 %, thus the HV final score is evaluated as the ratio of the number of points awarded to the maximum possible number of points (i.e. 15), expressed as a percentage, according to Equation (191).
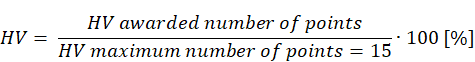
(191)
The HV final score indicates different degrees of the perceived heritage value, according to the following score ranges:
- The HV score ranging between 0 % and 20 % corresponds to very low perceived heritage value (i.e. the heritage site shows minimal representation of its intended period, style, or cultural aspect, with minimal environmental and aesthetic qualities, and architectural features lack significance and craftsmanship).
- The HV score ranging between 21 % and 40 % indicates a low heritage value (i.e. the heritage site representation of its intended period, style, or cultural aspect is limited, and environmental and aesthetic qualities are below average).
- The HV score ranging between 41 % and 60 % corresponds to moderate perceived heritage value (i.e. the heritage site moderately represents its intended period, style, or cultural aspect, possesses moderate environmental and aesthetic qualities, and while architectural features are satisfactory, there is room for improvement in terms of innovation and craftsmanship).
- The HV score ranging between 61 % and 80 % is associated to a strong perceived heritage value (i.e. the heritage site effectively represents its intended period, style, or cultural aspect, exhibits high environmental and aesthetic qualities, creating a positive overall atmosphere, and architectural features are significant).
- The HV score ranging between 81 % and 100 % indicates a very strong perceived heritage value (i.e. the heritage site excellently represents its intended period, style, or cultural aspect, excels in environmental and aesthetic qualities, creating an exceptional overall atmosphere, and architectural features are of outstanding significance).
Figure 96 shows the indicator thresholds used to associate indicator scores to performance classes for B.9.1. While these thresholds and performance classes are not directly applied in the evaluation of KPI and dimension scores and performance classes, they are included here to assist users in determining appropriate performance levels for specific project aspects and to offer clear guidance on their improvement.
Figure 96. B.9.1 indicative performance classes and thresholds

Source: JRC.
B.9.1 score can be increased by enhancing the historical material conservation through the implementation of conservation practices (ICOMOS, 2013) that prioritise the preservation of historical materials, façades, or surfaces with patina, utilising specialised techniques and materials to retain and protect existing patina, and contributing to the authenticity and historical character of the built environment. Other measures to improve B.9.1 score deal with the application of adaptive reuse methods to retain original and historic structural elements for new functional purposes to preserve their physical integrity and also add value to the contemporary use of the space. Furthermore, the integration of the preserved original or historic structural elements into the design can be promoted, thus presenting the preserved structural elements as distinctive features aimed to conserve the historical character and contribute to a sense of continuity with the past.
4.12.3 Integrated heritage/natural landscape conservation (B.9.2)
The integrated heritage landscape conservation (B.9.2) indicator assesses the combined efforts in preserving and restoring both traditional cultivated landscapes and original, historic urban green areas. It focuses on the coexistence of culturally significant cultivation practices and the revitalisation of urban green spaces, fostering an integrated approach to heritage conservation (i.e. the conservation of landscape qualities and sustainable use of natural resources, landscapes, and ecosystems). The indicator emphasises the importance of considering environmental factors in design and construction, with a view to minimising the ecological impact of human activities. The aim is to carry out actions to conserve and maintain the significant or characteristic features of a landscape, justified by its heritage value derived from its natural configuration and/or from human activity (Council of Europe, 2003; SWD, 2019).
B.9.2 indicator that only applies to statutory protected natural heritage is evaluated through the following two metrics:
Traditional cultivated landscape preservation and restoration (TLPR).
Preserved or recovered original, historic urban green spaces (PRGS).
B.9.2 score is estimated as the weighted average of the scores of the aforementioned two metrics (expressed as percentages), multiplied by 100, to obtain a dimensionless score ranging from 0 to 100, according to Equation (192).
(192)
Traditional cultivated landscape preservation and restoration (TLPR) metric evaluates the efforts to conserve or revive traditional landscapes. It considers sustainable cultivation practices, preservation of cultural heritage, and maintain ecological balance. The goal is to ensure the continuity of traditional cultivating methods while promoting environmental sustainability and cultural identity. TLPR metric assesses the overall extent of traditionally cultivated landscapes that have been conserved or revitalised in a project.
TLPR score computes the proportion of the preserved or revitalised area relative to the entire expanse, i.e. total area of the project site, expressed as a percentage, according to Equation (193).
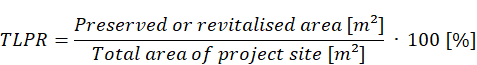
(193)
Preserved or recovered original, historic urban green spaces (PRGS) metric assesses the protection or regeneration of urban green spaces, both public and private, with a focus on preserving autochthonous and endemic greenery. It includes different green areas, such as parks, gardens, botanical gardens, and greenhouses. The aim is to maintain or restore the original character and biodiversity of these urban green areas, contributing to a healthier and more sustainable urban environment.
PRGS score estimates the ratio of the area of preserved or recovered original, historic urban green areas in a project site, to the total area of the project site, expressed as a percentage, according to Equation (194).
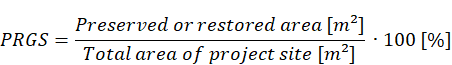
(194)
Figure 97 shows the indicator thresholds used to associate indicator scores to performance classes for B.9.2. While these thresholds and performance classes are not directly applied in the evaluation of KPI and dimension scores and performance classes, they are included here to assist users in determining appropriate performance levels for specific project aspects and to offer clear guidance on their improvement. Specifically, greater indicator scores associated with increasing performance classes (i.e. from Low to Excellent) indicate the corresponding growing efforts for the conservation of both traditional cultivated landscapes and historic urban green areas within a project.
Figure 97. B.9.2 indicative performance classes and thresholds.

Source: JRC.
B.9.2 score can be increased by promoting the heritage cultivation; hence, traditional cultivations that are historically significant to the local community needs to be prioritised to preserve biodiversity and maintain cultural connections to the region heritage. Other measures to improve the B.9.2 score refer to the protection of heritage trees and plants within the project area by implementing conservation measures including the identification, assessment, and safeguarding of trees and plants with historical or cultural significance.
4.12.4 Improving preservation of cultural and natural heritage in renovated buildings (B.9.3)
Improving preservation of cultural and natural heritage in renovated buildings (B.9.3) indicator aims to ensure that renovated buildings retain their historical and cultural integrity, contributing to the preservation of cultural and natural heritage in the built environment. The indicator emphasises the importance of restoration practices that respect and enhance the unique heritage value of each building or space (Council of Europe, 2021). This includes preserving the physical features, fabric and contents, minimising unnecessary change and implementing measures that mitigate any unavoidable loss of heritage significance.
B.9.3 indicator that only applies to not statutory protected cultural and natural heritage is assessed through the following five metrics:
- Preserved original/historic structural elements (PSE).
- Preserved original/historic openings (PO).
- Preserved or enhanced original, historic urban green spaces (PEGS).
- Interaction with immediate surrounding (IIS).
- Preserved key features of the building or space (PKF).
In the general form, B.9.3 score is evaluated as the weighted average of the scores of the aforementioned five metrics (expressed as percentages), multiplied by 100, to obtain a dimensionless score ranging from 0 to 100, according to Equation (195).
(195)
B.9.3 indicator pertains to not statutory protected cultural heritage, which include historic buildings that may range from high to low architectural and/or cultural value, thus historic buildings holding low original value are not considered as significant heritage buildings. Therefore, PSE, PO, and PKF metrics are applicable or not depending on whether the preservation of original structural elements, openings, and key features of a historic building significantly contribute to maintain the original value of the building or not. Indeed, in case of historic buildings with low architectural and/or cultural value, these preservation efforts may not be needed, as the intrinsic value of the building is not acknowledged. This means that PSE, PO, and PKF metrics are not applicable, and the evaluation of B.9.3 score only relies on PEGS and IIS metrics according to Equation (196).
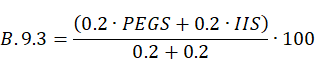
(196)
Preserved original/historic structural elements (PSE) metric, if applicable, as within B.9.1 indicator, deals with the conservation of original or historic structural elements of a building, including walls, floors, and roofs. The metric evaluates the extent to which original or historic structural elements are preserved during the renovation process, indicating the degree of conserving the historical integrity and authenticity of the building original structure.
PSE score is calculated as the ratio of the area of preserved original or historic structural elements (i.e. walls, floors, roofs) in square meters (m²) to the total floor area of the building in square meters (m²), expressed as a percentage, according to Equation (197).
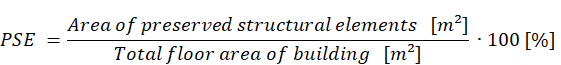
(197)
Preserved original/historic openings (PO) metric, if applicable, as within B.9.1 indicator, examines the preservation or replacement of original/historic openings, such as windows, shutters, and doors, during the renovation. The metric evaluates the extent to which original or historic openings have been maintained properly compared to the total number of openings, indicating the degree of preservation and considering its impact on the building historical character and architectural authenticity.
PO score estimates the ratio of the number of preserved original or historic openings (i.e. windows, shutters, doors) to the total number of openings, expressed as a percentage, according to Equation (198).
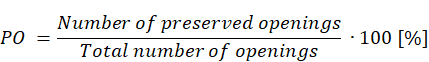
(198)
Preserved or enhanced original, historic urban green spaces (PEGS) metric evaluates how existing green spaces are managed within a project by focusing on whether these spaces are maintained in their original condition or improved to enhance their ecological, social, and aesthetic values, contributing to a healthier and more sustainable environment. The PEGS metric provides insights into the effectiveness of projects in maintaining or improving green infrastructure, promoting biodiversity, and enhancing the overall quality of the project environment.
PEGS score estimates the total area of preserved or enhanced green spaces in a project site, to the total area of the green spaces before the renovation intervention, expressed as a percentage, according to Equation (199).

(199)
Integration with immediate surrounding (IIS) metric assesses the extent to which a renovated building effectively integrate into its immediate surrounding environment, while safeguarding its cultural and natural heritage. The metric considers factors, such as architectural harmony, landscape integration, and compatibility with neighbouring buildings.
IIS score is evaluated through two sub-metrics, i.e. (i) historical context sensitivity, and (ii) conservation planning to which assign a rate based on a scale of points (i.e. 0 to 5), depending on the absence/presence and relevance degree of their specific features within a renovation project, according to the rationale provided in Table 133.
Table 133. Integration with immediate surrounding (IIS) metric score.
| Sub-metric | Score (points) |
| Rate each sub-metric below according to a scale of points (0-5, where 0 corresponds to absence of feature, 1 to very weak, 2 to weak, 3 to moderate, 4 to strong, and 5 to very strong presence of feature and sum the two scores | |
| Historical context sensitivity: evaluate whether and how the renovation respects and responds to the historical context of the surrounding area, including preservation of architectural heritage and cultural significance? | 0 to + 5 |
| Conservation planning: evaluate whether and how the renovation aligns with established conservation plans or heritage management strategies for the area, ensuring that interventions are guided by principles of heritage conservation and sustainable development? | 0 to + 5 |
| Integration with immediate surroundings (IIS) metric score = Σ sub-metric scores | 0 ≤ IIS ≤ 10 |
Source: JRC.
The IIS score, expressed in points, needs to be transformed into a score, expressed as a percentage, ranging from 0 % to 100 %, thus the IIS final score is evaluated as the ratio of the number of points awarded to the maximum possible number of points (i.e. 10), expressed as a percentage, according to Equation (200).
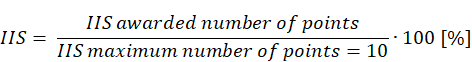
(200)
The IIS final score indicates different degrees of the perceived integration with the immediate surroundings, according to the following score ranges:
- The IIS score ranging between0 % and 20 % corresponds to a very weak perceived integration with surroundings (i.e. the place exhibits minimal to no discernible integration with its surroundings).
- The IIS score ranging between 21 % and 40 % indicates a weak perceived integration with surroundings (i.e. integration is below average, with notable deficiencies in criteria).
- The IIS score ranging between 41 % and 60 % indicates a moderate perceived integration with surroundings (i.e. the place demonstrates moderate integration, meeting basic criteria in most aspects).
- The IIS score ranging between 61 % and 80 % corresponds to a strong perceived integration with surroundings (i.e. integration is above average, with positive performance in most criteria, some refinements could further enhance the overall integration).
- The IIS score ranging between 81 % and 100 % refers to a very strong integration with surroundings (i.e. the place exhibits effective overall integration in assessed criteria).
Preserved key features of building or space (PKF) metric, if applicable, focuses on the maintenance of key historical and architectural features that define the building character and identity. It examines whether the building original purpose, unique architectural elements, and social significance are preserved, ensuring the continuity of its historical narrative. The metric evaluates the preservation of the building historical purpose, and the social value it holds within its community.
The PKF score is evaluated through two sub-metrics: (i) social value and (ii) historic and cultural relevance to which assign a rate based on a scale of points (i.e. 0 to 5), depending on the absence/presence and relevance degree of their specific features within a project, according to the rationale in Table 134.
Table 134. Preserved key feature of building or space metric score.
| Sub-metric | Score (points) |
| Rate each sub-metric below according to a scale of points (0-5, where 0 corresponds to absence of feature, 1 to very weak, 2 to weak, 3 to moderate, 4 to strong, and 5 to very strong presence of feature) and sum the two scores | |
| Social value: evaluate the social value that the building or space holds within its community; its role in local history, cultural identity, community memory, or social cohesion. | 0 to + 5 |
| Historic and cultural relevance: evaluate the degree to which the building or space remains culturally relevant to the community, and whether it continues to serve its original purpose or has been adapted to meet contemporary needs while retaining its historical identity. | 0 to + 5 |
| Preserved key feature of building or space (PKF) metric score = Σ sub-metric scores | 0 ≤ PKF ≤ 10 |
Source: JRC.
The PKF score, expressed in points, needs to be transformed into a score, expressed as a percentage, ranging from 0 to 100 %, thus the PKF final score is evaluated as the ratio of the number of points awarded to the maximum possible number of points (i.e. 10), expressed as a percentage, according to Equation (160).
(201)
The PKF final score indicates different degrees of the perceived preservation of key historical features, according to the following score ranges:
- The PKF score ranging between 0 % and 20 % corresponds to a very weak perceived preservation (i.e. minimal preservation efforts observed, with significant loss or degradation of key historical features, limited adherence to preservation guidelines, and minimal recognition of social value within the community).
- The PKF score ranging between 21 % and 40 % is associated to a weak perceived preservation (i.e. limited preservation achieved, with some effort made to retain key historical features, but notable alterations or compromises in authenticity and social relevance).
- The PKF score ranging between 41 % and 60 % indicates a moderate perceived preservation (i.e. moderate preservation efforts are evident, with a balanced approach to retaining key historical features, while accommodating contemporary needs, and partly recognition of social value within the community is also evident).
- The PKF score ranging between 61 % and 80% corresponds to a strong perceived preservation (i.e. substantial preservation is achieved, with significant retention of key historical features, adherence to preservation guidelines, and recognition of social value within the community).
- The PKF score ranging between 81 % and 100% indicates a very strong perceived preservation (i.e. exceptional preservation efforts are demonstrated, with attention to retaining and restoring key historical features and widespread recognition of social value within the community).
Figure 98 shows the indicator thresholds used to associate indicator scores to performance classes for B.9.3. While these thresholds and performance classes are not directly applied in the evaluation of KPI and dimension scores and performance classes, they are included here to assist users in determining appropriate performance levels for specific project aspects and to offer clear guidance on their improvement. . Specifically, the four ranges of B.9.3 scores equal to (i) 0 ≤ B.9.3 < 20, (ii) 20 < B.9.3 ≤ 50, (iii) 50 < B.9.3 ≤ 70, and (iv) 70 ≤ B.9.3 ≤ 100 are associated with the Low, Acceptable, Good and Excellent performance class, respectively. The B.9.3 scoring range categorises the overall preservation efforts into different levels based on the improved perseveration of cultural and natural heritage in renovated buildings. A higher score indicates a more comprehensive preservation, while a lower score suggests a lesser degree of preservation.
Figure 98. B.9.3 indicative performance classes and thresholds.

Source: JRC.
B.9.3 score, similarly to B.9.1 score, can be increased by enhancing preservation efforts through the identification of additional opportunities to preserve the original architectural elements or historical features within a building and the use of specialised restoration techniques to restore deteriorated components. Other measures to improve B.9.1 score deal with the application of adaptive reuse methods to retain original and historic structural elements for new functional purposes to preserve their physical integrity and also add value to the contemporary use of the space. However, the preservation of most of the structural elements could not be feasible in a project. In this case, a selective restoration, aimed at prioritising the restoration of key original or historic openings that contribute significantly to the architectural character, should be envisaged. The focus on the most distinctive or culturally significant elements demonstrates targeted and impactful preservation efforts.
4.12.5.1 Example (B.9): buildings and spaces with statutory protection
The hypothetical project focuses on the restoration and adaptive reuse of a statutory protected historic industrial building within an urban context. The primary goal is to transform the building into a vibrant and functional space while preserving its historical significance. The existing industrial building holds great historical importance, representing an example of a crucial era in the city industrial development. To maintain its historical integrity, efforts are made to preserve original features, such as exposed brickwork, large factory windows, and industrial elements that reflect the history of the building. However, the project also aims to modernise the building to meet current needs, creating a balance between preservation and adaptation. This involves introducing contemporary design elements while respecting the historical character of the structure. Surrounding the building, historic urban green areas and traditionally cultivated landscapes are integrated into the design of the renovation project. Additionally, sustainable land use practices are incorporated, including the use of native plants, water-efficient landscaping, and environmentally conscious maintenance practices. Specifically, the total area of the project site is equal to 5000 m2, while the total floor area of the building is 1000 m2 square meters.
The evaluation of B.9 for projects with statutory protection, as in the example, depends on the scores of B.9.1 and B.9.2 indicators (i.e. B.9.3 indicator is omitted).
B.9.1 score is evaluated through the following four metrics: (i) preserved patina, (ii) preserved original/historic structural elements, (iii) preserved original/historic openings, and (iv) heritage value.
Preserved patina metric is evaluated based on the assumption that the area of preserved patina represents the intentional conservation of aged surfaces of the external walls of a building. Following a careful cleaning and minimal intervention techniques to retain the original patina, while removing any harmful substances that may compromise its longevity, the area of preserved patina of the analysed building is estimated equal to 650 m2. The total area of the external walls of the building is equal to 1000 m2, thus the PP score is evaluated using Equation (188) and results into a value equal to 65 %, according to Equation (202).
 |
(202)
Preserved original/historic structural elements (PSE) metric that supports the preservation of the structural elements of a statutory protected historic/cultural building contributing to the structural and visual integrity of cultural heritage, is evaluated by first defining the area of preserved structural elements intentionally retained during the restoration process, which is estimated equal to 750 m2. The total floor area of the building is 1000 m2, thus the PSE score is estimated by using Equation (189) and it is found to be equal to 75 %, according to Equation (203).
 |
(203)
Preserved original/historic openings (PO) metric is estimated by first counting the original openings that have been intentionally retained during the restoration process. These include windows, doors, and other architectural openings that were part of the building original design and construction, leading to a number of preserved openings equal to 80 out of the total number of 100 openings present in the analysed building. Hence, the PO score is calculated using Equation (190) and results into a value equal to 80%, according to Equation (204).
(204)
Heritage value (HV) metric is first evaluated in points based on the presence/absence and degree of relevance of the specific features related to the three sub-metrics, i.e. representativeness, ambient value, and aesthetic coherence, within the heritage site project (Table 132), as reported in the following, leading to the HV score in points equal to 14 (out of 15), as reported in Table 135. Specifically, regarding representativeness, the industrial building effectively represents the city industrial history, capturing the essence of the era with attention to detail and historical accuracy. Regarding the ambient value, the environmental and aesthetic qualities of the site are commendable, integrating well with the urban context and the adaptive reuse enhances the overall atmosphere. Regarding the aesthetic coherence, the architectural features, including original structural elements and openings, are significant and the adaptive reuse combines historical significance with modern functionality.
Table 135. Example of heritage value (HV) evaluation.
| Sub-metric | Score (points) |
| Rate each sub-metric below according to a scale of points (0-5, where 0 corresponds to absence of feature, 1 to very weak, 2 to weak, 3 to moderate, 4 to strong, and 5 to very strong presence of features) and sum the three scores. | |
| Representativeness: evaluate how the heritage site represents a particular period, style, or cultural aspect? | + 5 (very strong) |
| Ambient value: evaluate the heritage site environmental and aesthetic qualities, consider its natural surroundings, landscape, and overall atmosphere. | + 4 (strong) |
| Aesthetic coherence: evaluate the architectural significance, innovation, and craftsmanship of the buildings within the heritage site. | + 5 (very strong) |
| Heritage value (HV) metric score = Σ sub-metric scores | HV = 14 |
Source: JRC.
The HV score, expressed in points, is transformed into the HV final score by using Equation (160), thus estimating equal to 93.3 %, as provided through Equation (178). According to the significance of the five score ranges corresponding to different degrees of the perceived heritage value (Section 4.12.2), the HV score indicates a very strong perceived heritage value. It effectively represents the intended period, high environmental and aesthetic qualities, and the architectural features are significant. The adaptive reuse balances historical integrity with modern functionality, contributing positively to the urban context.
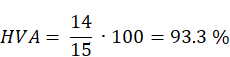
(205)
Having evaluated the score of each metric, B.9.1 score is calculated according to Equation (187)(151), resulting into a value equal to 78.3, corresponding to the indicative Excellent performance class (Figure 96), as reported in Table 136. The indicator score indicates that the project holds an excellent preservation due to a comprehensive approach to the restoration and reuse of the historic industrial building, highlighting the successful balance between historic integrity and contemporary functionality, mainly emphasised by the efforts to preserve the patina the original structural elements and the historic openings of the building.
Table 136. Example of B.9.1 evaluation
| Metric | PP | PSE | PO | HV |
| Metric score | 65 % | 75 % | 80 % | 93.3 % |
| B.9.1 score | = (0.25 ∙ 65 % + 0.25 ∙ 75 % + 0.25 ∙ 80 % + 0.25 ∙ 93.3%) ∙ 100 = 78.3 | |||
| B.9.1 performance class | (Excellent)1 | |||
- 1 Transformation of the indicator score to an indicator performance class is indicative and not required by the self-assessment method to estimate KPI and dimension scores and performance classes.
Source: JRC.
B.9.2 score is evaluated through the following two metrics: (i) traditional cultivated landscape preservation and restoration, and (ii) preserved or recovered original, historic urban green areas.
Traditional cultivated landscape preservation and restoration (TLPR) metric is evaluated based on the following two sub-metrics: (i) the preserved area of traditional cultivated landscape within the project is equal to 2000 m2 and (ii) the area of the project site is 5000 m2. Hence, the TLPR score is calculated using Equation (193), thus resulting into a value equal to 40 %, according to Equation (206).
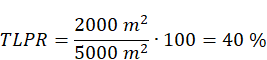 |
(206)
Preserved or recovered original, historic urban green spaces (PRGS) metric is evaluated based on the following sub-metrics: (i) the area of recovered original, historic green spaces within the project is equal to 2500 m2 and (ii) the area of the project site is 5000m2. Hence, TLPR score is calculated using Equation (194) and results into a value equal to 40 %, as reported in Equation (207).
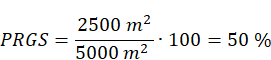 |
(207)
Having evaluated the score of each metric, B.9.2 score is calculated according to Equation (192)(162), resulting into a value equal to 45, corresponding to the indicative Acceptable performance class (according to Figure 97), as reported in Table 137. The project demonstrates a commitment to preserving both traditionally cultivated landscapes and historic urban green areas. Although B.9.2 score can be improved to attain a better performance, the project lays the foundation for heritage conservation and urban green space revitalisation, contributing positively to the historical and ecological fabric of the urban environment.
Table 137. Example of B.9.2 evaluation
| Metric | TLPR | PRGA |
| Metric score | 40 % | 50 % |
| B.9.2 score | = (0.5 ∙ 40 % + 0.5 ∙ 50 %) ∙ 100 = 45 | |
| B.9.2 performance class | (Acceptable)1 | |
- 1 Transformation of the indicator score to an indicator performance class is indicative and not required by the self-assessment method to estimate KPI and dimension scores and performance classes.
Source: JRC.
Having evaluated the two indicators, B.9 score is estimated using Equation (185) and it is found to be equal to65, which corresponds to the Good performance class (according to Figure 95Figure 91), as reported in Table 138. This score indicates good conservation efforts of the project regarding building preservation, as well as historical natural heritage preservation. In terms of building preservation, the project demonstrates a strong commitment to maintaining the historical integrity of the former industrial building. The adaptive reuse of the building ensures its continued relevance and functionality while respecting its historical character. Regarding historical natural heritage preservation, the project excels in integrating urban green spaces and traditionally cultivated landscapes into the surrounding area. These elements not only enhance the aesthetic appeal of the project but also contribute to the preservation of the natural heritage of the site. Overall, the project efforts in both building and natural heritage preservation contribute to a positive score, indicating a successful balance between historical conservation and contemporary adaptation within the urban context.
Table 138. Example of B.9 (project statutory protected) evaluation.
| Indicator | B.9.1 | B.9.2 |
| Indicator score | 78.3 | 45 |
| B.9 score | = 0.6 ∙ 78.3 + 0.4 ∙ 45 = 65 | |
| B.9 performance class | Good | |
| B.9 performance class score (PCSB.9) | 70 | |
Source: JRC.
4.12.5.2 Example (B.9): buildings without statutory protection but with historical significance
The hypothetical project focuses on the restoration of a building within a historic urban context. The building is part of a planned city block that dates back to the early 20th century and is integral to the wider city centre. Although certain parts of the city block hold significant historical value, the building itself is not statutory protected. However, the tenants have decided to renovate the building, aiming to preserve its original elements and appearance as much as possible, acknowledging its intrinsic value to the urban fabric. Situated within the city block, the building has a total floor area of 2000 m2.
The evaluation of B.9 for cultural heritage projects without statutory protection depends on B.9.3 indicator (i.e. B.9.1 and B.9.2 are omitted), which is estimated through the following five metrics: (i) preserved original/historic structural elements, (ii) preserved original/historic openings, (iii) preserved or enhanced green areas, (iv) interaction with immediate surrounding, and (v) preserved key features of the building or space. The building has a high cultural value, although it is not statutory protected, so the preserved original/historic structural elements, the preserved original/historic openings, and the preserved key features metrics are applicable for B.9 evaluation.
Preserved original/historic structural elements (PSE) metric is evaluated based on the assumption that an area of original structural elements, including walls and ceilings, equal to 800 m² have been preserved through renovation efforts. Hence, the PSE score is evaluated using Equation (197) and results into a value equal to 40 %, according to Equation (208).
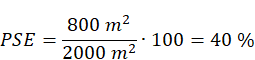
(208)
Preserved original/historic openings (PO) metric is evaluated based on the following sub-metrics: the building accounts for 50 openings, comprising windows and doors, and an amount of 35 out of the total number of 50 openings have been painstakingly preserved. Hence, PO score is estimated according to Equation (198) and results into a value equal to 70 %, as reported in Equation (209).
(209)
Preserved or enhanced original/historic green spaces (PEGS) metric is evaluated based on the assumption that green spaces, accounting for a total area equal to 500 m², within the vicinity of the renovated building were carefully considered during the renovation. Efforts led to the preservation and enhancement of an area of these green spaces equal to 300 m². Hence, PEGS score is estimated using Equation (199) resulting equal to 60 %, as reported in Equation (210).
 |
(210)
Integration with the immediate surroundings (IIS) metric is first evaluated in points (Table 133) based on the presence/absence and degree of relevance of the specific features related to the two sub-metrics, i.e. historical context sensitivity, and conservation planning, as reported in the following, leading to the IIS score in points equal to 9 (out of 10), as reported in Table 139.
Historical context sensitivity was of great importance during renovation, as reflected in the approach to the renovation by ensuring that the architectural elements and design choices were harmonised with the historical fabric of the surrounding environment.
Conservation planning efforts align into the established strategies by adhering to conservation guidelines and incorporating sustainable practices.
Table 139. Example of integration with immediate surroundings (IIS) evaluation.
| Sub-metric | Score (points) |
| Rate each sub-metric below according to a scale of points (0-5, where 0 corresponds to absence of feature, 1 to very weak, 2 to weak, 3 to moderate, 4 to strong, and 5 to very strong presence of feature and sum the two scores | |
| Historical context sensitivity: evaluate whether and how the renovation respects and responds to the historical context of the surrounding area, including preservation of architectural heritage and cultural significance? | + 4 |
| Conservation planning: evaluate whether and how the renovation aligns with established conservation plans or heritage management strategies for the area, ensuring that interventions are guided by principles of heritage conservation and sustainable development? | + 5 |
| Integration with immediate surroundings (IIS) metric score = Σ sub-metric scores | IIS = 9 |
Source: JRC.
The IIS score, expressed in points, is transformed into the IIS final score by using Equation (200), thus estimating equal to 90 %, as provided through Equation (211). According to the five score ranges corresponding to different degrees of the perceived integration with the immediate surroundings (Section 4.12.2), the IIS score indicates a very strong perceived integration with surroundings.
(211)
Preserved key features of building or space (PKF) metric is first evaluated in points (Table 134) based on the presence/absence and degree of relevance of the specific features related to two sub-metrics, i.e. social value and historic and cultural relevance, as reported in the following, leading to the PKF score in points equal to 8 (out of 10), as reported in Table 140.
Social value – the project reveals a strong social value within the community, through its connection with local history and cultural identity for which the building remains a significant asset.
Historical and cultural significance – the renovation project ensured that the historical and cultural significance was unmodified and carefully preserved throughout the renovation process.
Table 140. Example of preserved key feature of building or space (PKF) evaluation.
| Sub-metric | Score (points) |
| Rate each sub-metric below according to a scale of points (0-5, where 0 corresponds to absence of feature, 1 to very weak, 2 to weak, 3 to moderate, 4 to strong, and 5 to very strong presence of feature) and sum the two scores | |
| Social value: evaluate the social value that the building or space holds within its community; its role in local history, cultural identity, community memory, or social cohesion. | 4 |
| Historic and cultural relevance: evaluate the degree to which the building or space remains culturally relevant to the community, consider whether it continues to serve its original purpose or has been adapted to meet contemporary needs while retaining its historical identity. | 4 |
| Preserved key feature of building or space (PKF) metric score = Σ sub-metric scores | PKF = 8 |
Source: JRC.
The PKF score, expressed in points, is transformed into the PKF final score by using Equation (201), thus estimating equal to 80 %, as provided through Equation (212). According to the five score ranges corresponding to different degrees of the perceived integration with the immediate surroundings (Section 4.12.4), the PKF score indicates a very strong perceived preservation of key historical feature
(212)
Having evaluated the score for each metric, B.9.3 score is estimated according to Equation (195). B.9.3 score corresponds to B.9 score for non-statutory protected buildings (Equation (186)), which is estimated equal to 68 %, thus resulting into a Good performance class (Figure 95), as reported in Table 141. The B.9 score indicates that the historic building renovation project exemplifies an effort in preserving the cultural and natural heritage, while bringing vitality into the urban fabric by integrating modern elements to enhance its functionality and appeal.
Table 141. Example of B.9.3 and B.9 (non-statutory protection) evaluation.
| Indicator | B.9.3 |
| Indicator score | = (0.2 ∙ 40 % + 0.2 ∙ 70 % + 0.2 ∙ 60 % + 0.2 ∙ 90 % + 0.2 ∙ 80 %) ∙ 100 = 68 |
| Indicator performance class | (Good)1 |
| B.9 score | = 1 ∙ 68 = 68 |
| B.9 performance class | Good |
| B.9 performance class score (PCSB.10) | 70 |
- 1 Transformation of the indicator score to an indicator performance class is indicative and not required by the self-assessment method to estimate KPI and dimension scores and performance classes.
Source: JRC.
4.13 Maintaining genius loci and improving sense of belonging (B.10)
4.13.1 Description and assessment
Maintaining genius loci and improving the sense of belonging (B.10) KPI aims to preserve the unique character and essence of a place, commonly referred to as genius loci, while nurturing an emotional bond and attachment among community members. Genius loci is connected with the concept of sense of place, which relates to the authenticity (a clear definition of authenticity is provided in the ‘List of abbreviations and definition’ section) of the built and non-built environment, characterised by its social fabric and all associated interaction, as well as its natural and physical identity (European Commission, 2021b). This encompasses the preservation of historical and cultural elements and the promotion of sustainable practices that uphold local identity (COM, 2018). Achievement is assessed through heightened appreciation for the distinct identity of the locale inhabitants. B.10 emphasises the importance of the sense of belonging within the community and the distinctiveness of the places, serving as a tool to promote community cohesion and resilience, as well as recognising and preserving the unique spirit of a place, not only by replicating “ancient” models, but also highlighting the identity of the place and reinterpreting it in a contemporary manner.
B.10 is evaluated through one main indicator, as follows:
- Sense of place harmony (B.10.1), which aims to foster or recognise and preserve the unique spirit of a place, encompassing its characteristic features and emotional identity.
B.10 score, ranging from 0 to 100, is calculated according to the Equation (213).
(213)
Figure 99 provides B.10 performance classes and thresholds adopted in the self-assessment method. Hence, the four ranges of B.10 score, equal to 0 ≤ B.10 < 20, 20 ≤ B.10 < 50, 50 ≤ B.10 < 80, and 80 ≤ B.10 ≤ 100, correspond to Low, Acceptable, Good, and Excellent performance class, respectively. It is highly recommended that B.10 attains as a minimum the Acceptable performance class. This recommendation points out the importance of preserving the genius loci and enhancing the sense of belonging within communities. Increased appreciation of the distinct identity of the inhabitants of a place serves as a measure for evaluating what has been achieved.
Figure 99. B.10 performance classes and thresholds.

Source: JRC.
The B.10 KPI and its corresponding indicator can be applied to projects at building, neighbourhood and urban scale, considering both newbuild and renovation project types, exclusively with non-residential use, thus excluding residential buildings, as the KPI evaluates the project alignment with the community's values. Specifically, at building scale, B.10 and B.10.1 can be applied to new buildings and the redevelopment of single buildings, ensuring that the sense of place harmony is maintained within the project environment. At neighbourhood and urban scale, B.10 and B.10.1 can be applied to large parts of an urban area or a village/city, referring to geographic areas that constitute a distinct neighbourhood or larger portions of a city. B.10 and B.10.1 can be applied to historical environments, natural landscapes, and heritage sites where maintaining a sense of place harmony is crucial for upholding the cultural identity and emotional resonance of the area. At building and neighbourhood scales, the features of the cultural landscape should be viewed within the context of the broader landscape of which they are an integral part.
4.13.2 Sense of place harmony (B.10.1)
Each "place" possesses distinct character and attributes that contribute to its unique presence or genius loci (Norberg-Schulz, 1980). The genius loci that differentiates each place is defined by how a culture attributes diverse textures, forms, and meanings to its environment (Karaman, 2001). Thus, the place reflects how individuals or groups have transformed their living spaces, with their responses to environmental limitations or potentials etched into the landscape (a clear definition of landscape is provided in the List of abbreviations, symbols and definitions section). Sense of belonging is intended as the capability to adapt to the qualities of the place, either as inherited from previous generations and civilizations, or as jointly created for the future. It is the willingness to contribute to the preservation and enhancement of existing, and mostly objective qualities, but also behave respectfully towards other individuals, past, present and future, of the social groups inhabiting the place, being it either a community on the traditional form or a new community, today defined as heritage or aesthetic.
The Sense of place harmony (B.10.1) indicator assesses the unique cultural identity, emotional resonance, and sense of place within a designated geographic area, emphasising these elements imbued with deeper significance for its inhabitants. It examines whether spatial solutions within a project consider the needs of individuals, communities, spaces and places, of values and resources (European Commission, 2021b).
B.10.1 indicator is assessed through the following two metrics:
- Rareness of landscape/heritage site types (RS).
- Sense of attachment (SA).
B.10.1 score, ranging from 0 to 100, is calculated as the weighted average of the aforementioned two metric scores, according to Equation (214).
(214)
Rareness of landscape/heritage site types (RS) metric assesses and quantifies the uniqueness and scarcity of specific landscape or site types within a defined geographic area. The metric acknowledges that certain landscapes or sites possess distinctive features, ecological elements, or cultural characteristics that contribute to their rarity. A landscape or site can be recognised and determined as a cultural landscape, based on the interaction of humankind and the natural environment, according to one of the following three categories (World Heritage Centre, 2008):
- The ‘clearly defined landscape designed and created intentionally by man’ includes garden and parkland landscapes, which are constructed for aesthetic reasons, often (but not always) associated with religious or other monumental buildings and ensembles.
- The ‘organically evolved landscape’ has evidence of the human interaction with the natural environment, but it is changed and developed over time. Interaction between different elements (i.e. social, economic, administrative, and/or religious imperative) and the land is evident.
- The ‘associative cultural landscape’, in which religious, artistic or cultural features are associated with the environmental elements. However, the evidence of historical human use of the site may be missing.
The three categories of landscapes or sites can be inscribed to a heritage list referring to a specific legal framework at local, national or international level, thus achieving official protection and resulting into protected landscape (i.e. statutory protected area) or heritage site; alternatively, they can be protected by a spatial plan at local or regional level.
RS metric evaluates whether a project satisfies the aforementioned features to be recognised as a cultural landscape or heritage site. The rationale for the evaluation of RS score, which can be equal to ten different fixed values, expressed as percentages, is presented in Table 142.
Table 142. Rareness of landscape/site types (RS) metric score
| Sub-metric | Score |
| Select single value below. | |
| Landscape or site not recognised as a cultural or natural landscape | 0 % |
| Landscape having features of one out of the three categories of cultural landscape: ‘clearly defined landscape’, or ‘organically evolved landscape’, or ‘associative cultural landscape’ | 20 % |
| Landscape having features of two out of the three categories of cultural landscape | 30 % |
| Landscape having features of all the three categories of cultural landscape: ‘clearly defined landscape’, and ‘organically evolved landscape’, and ‘associative cultural landscape’ | 40 % |
| Landscape protected by a spatial plan at local level | 50 % |
| Landscape protected by a spatial plan at regional level | 60 % |
| Landscape or heritage site protected at local level | 70 % |
| Landscape or heritage site protected at regional level | 80 % |
| Landscape or heritage site protected at national level | 90 % |
| Landscape or heritage site protected at international level | 100 % |
| RS metric score = Selected sub-metric score | RS = one of the fixed value above |
Source: JRC
Sense of attachment (SA) metric evaluates the extent to which individuals experience a sense of attachment and emotional connection to a building, landscape or site. The metric considers the emotional bonds people create with the environment, reflecting on how they perceive and interact with a building, landscape or heritage site. The evaluation of sense of attachment aims to ascertain the degree to which community’s sense of identity and belonging to a building or site are upheld, thus a project should ensure the preservation of local unique character and identity, as well as the consistency of its use with the level of carrying capacity of the area that can be sustainably supported without causing significant negative impacts on the quality of life.
SA score is evaluated through two sub-metrics: (i) community's sense of identity and belonging, and (ii) quality and well-being of the inhabitants, to which assign a score based on a scale of points (i.e. 0 to 5), according to the rationale in Table 143.
Table 143. Sense of attachment (SA) metric score.
| Sub-metric | Score (points) |
| Rate each sub-metric below according to a scale of points (0-5, where 0 corresponds to absence of feature, 1 to very weak, 2 to weak, 3 to moderate, 4 to strong, and 5 to very strong presence of features) and sum the two scores | |
| Community's sense of identity and belonging: evaluate the extent to which the project takes into account the context and unique local character that is characterised by its distinctiveness, authenticity and identity, considering both tangible (e.g. architectural features, landscaping and surroundings, functional features, etc.) and intangible aspects (e.g. cultural practices, social interactions, etc.), thus fostering a strong sense of connection and contributing to a sense of belonging. | 0 to + 5 |
| Quality and well-being of the inhabitants: evaluate the extent to which the use of building or space is consistent with the carrying capacity of the area and ensures the preservation or improvement of the spatial quality and well-being of the inhabitants of the area. | 0 to + 5 |
| Sense of attachment (SA) metric score = Σ sub-metric scores | 0 ≤ SA ≤ 10 |
Source: JRC.
The SA score, expressed in points, needs to be transformed into a score, expressed as a percentage, ranging from 0 % to 100 %, thus the final SA score is evaluated as the ratio of the number of points awarded to the maximum possible number of points (i.e. 10), multiplied by 100, according to Equation (187).
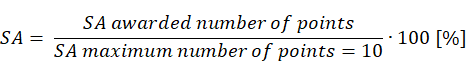
(215)
The SA score indicates different degrees of the project contribution to the sense of attachment, according to the following score ranges:
- The score ranging between 0 % and 20 % corresponds to a very weak perceived contribution of the project to the sense of attachment (the impact is insufficient, and there is little to no positive influence).
- The score ranging between 21 % and 40 % corresponds to a weak perceived contribution to the sense of attachment (the self-assessed project has a limited contribution, and improvements are needed to strengthen community ties).
- The score ranging between 41 % and 60 % indicates a moderate perceived contribution to sense of attachment (the assessed project has a satisfactory and balanced contribution).
- The score ranging between 61 % and 80 % corresponds to a strong perceived contribution to the sense of attachment (the assessed project has a substantial and noticeable contribution to the sense of attachment),
- The score ranging between 81 % and 100 % is associated with a very strong perceived contribution to the sense of attachment (the assessed project has transformative contribution to the community's sense of attachment, deeply shaping community identity and creating a strong sense of belonging among community members).
Figure 100 shows the indicator thresholds used to associate indicator scores to performance classes for B.10.1. While these thresholds and performance classes are not directly applied in the evaluation of KPI and dimension scores and performance classes, they are included here to assist users in determining appropriate performance levels for specific project aspects and to offer clear guidance on their improvement. As expected, the thresholds for B.10.1 correspond to the ones defined for B.10. Specifically, a high B.10.1 score, corresponding to an indicative Good or Excellent performance class, suggests that the project is adequately preserving the unique cultural identity, emotional resonance, and sense of place within the designated geographic area, emphasising elements with deeper significance for its inhabitants. It implies a higher level of harmony with the cultural and natural heritage of the region.
Figure 100. B.10.1 indicative performance classes and thresholds.

Source: JRC.
B.10.1 score can be increased by enhancing the preservation of original urban/cultural environment through the prioritisation of the alignment with the original appearance of the urban or cultural environment in new or renovated elements. This can achieved by using photographic analysis, maps, and drawings to guide the design process, and ensuring a high degree of preservation of the intrinsic nature of the area. Other measures to improve B.10.1 score concern the increase of the community involvement. Specifically, the local community should be involved during the project planning and decision-making phase to seek their input, opinions and preferences ensuring the project alignment with the values of the community. Furthermore, attention needs to be drawn on cultural sensitivity and inclusivity. Specifically, it is essential to invest time to understand the community's unique history, traditions and cultural dynamics in order to tailor the project to reflect and respect these cultural elements, thus fostering a sense of cultural identity and inclusivity.
4.13.3 Example (B.10)
The hypothetical project refers to the redevelopment of an urban area with historical significance. The project aims to revitalise the existing urban area while preserving its cultural heritage and meeting the evolving needs of the community. To achieve this goal, the project emphasises substantial revitalisation efforts by involving engaging community members, local businesses, and other stakeholders in the planning and decision-making processes. By involving the community, the project ensures that it aligns with their values and aspirations. One of the key aspects of the redevelopment is the incorporation of public art installations which serve as focal points within the urban area, contributing to its visual appeal. Public art installations convey stories and narratives that resonate with the community, further strengthening the cultural identity of the area. Overall, the project seeks to breathe new life into the urban area, while honouring its past and meeting the needs of the present community. Through collaboration and thoughtful design, it aims to create a vibrant and inclusive space that celebrates the cultural heritage of the area.
The evaluation of B.10 depends on the score of B.10.1 indicator, which is estimated through the rareness of landscape/site types and sense of attachment metrics.
Rareness of landscape/site types metric is evaluated by comparing the example neighbourhood scale project with the features to recognise a landscape as cultural, according to the sub-metrics in Table 142. Based on the comparison, the project area is recognised as a cultural landscape with features of the ‘clearly defined landscape’ and the ‘associative cultural landscape’ categories of cultural landscape, thus RS score is estimated equal to 30, as the project area has features of two out of the three categories of cultural landscape (based on the assessment of the project evaluator).
Sense of attachment metric is first evaluated in points based on the presence/absence and degree of relevance of the specific features related to the two sub-metrics, i.e. community's sense of identity and belonging, and quality and well-being of the inhabitants (Table 143), as reported in the following, leading to the SA score in points equal to 8 (out of 10), as reported in Table 144. Specifically, regarding the community's sense of identity and belonging, the project approach, incorporating historical preservation, cultural integration, and community engagement, suggests a moderate positive impact on community’s identity and belonging, thus attaining a score of 3 points. Regarding the quality and well-being of the inhabitants, the project acknowledges and preserves the historical significance of the urban area and this contextual understanding leads to a very strong positive influence on community attachment, thus earning a score of 5 points.
Table 144. Example of sense of attachment evaluation.
| Sub-metric | Score (in points) |
| Rate each sub-metric below according to a scale of points (i.e. 0-5, where 0 corresponds to absence of features, 1 to very weak, 2 to weak, 3 to moderate, 4 to strong, and 5 to very strong presence of features) and sum the two scores. | |
| Community's sense of identity and belonging: evaluate the extent to which the project takes into account the context and unique local character that is characterised by its distinctiveness, authenticity and identity, considering both tangible (e.g. architectural features, landscaping and surroundings, functional features etc.) and intangible aspects (e.g. cultural practices, social interactions etc.), thus fostering a strong sense of connection and contributing to a sense of belonging. | + 3 |
| Quality and well-being of the inhabitants: evaluate the extent to which the use of building or space is consistent with the carrying capacity of the area and ensures the preservation or improvement of the spatial quality and well-being of the inhabitants of the area. | + 5 |
| Sense of attachment (SA) metric score = Σ sub-metric scores | SA = 8 |
Source: JRC.
The SA score, expressed in points, is transformed into the SA final score by using Equation (187), thus resulting equal to 80, as reported in Equation (216). According to the significance of the five score ranges corresponding to different degrees of the perceived sense of attachment (Section 4.13.2), the SA score indicates a strong perceived contribution to the sense of attachment.
 |
(216)
Having evaluated the score for each metric, B.10.1 score is estimated according to Equation (214), which corresponds to B.10 score (Equation (213)), thus resulting into a Good performance class (Figure 99), as reported in Table 145. The result is showcasing a strong commitment to preserving the cultural heritage of the area while fostering a sense of community belonging.
Table 145. Example of B.10.1 and B.10 evaluation.
| Indicator | B.10.1 |
| Indicator score | = 0.5 ∙ 30 + 0.5 ∙ 80 = 55 |
| Indicator performance class | (Good)1 |
| B.10 score | = 1 ∙ 55 = 55 |
| B.10 performance class | Good |
| B.10 performance class score (PCSB.10) | 70 |
1 Transformation of the indicator score to an indicator performance class is indicative and not required by the self-assessment method to estimate KPI and dimension scores and performance classes.
Source: JRC.
4.14 Understanding aesthetic perception of buildings and spaces through comparison to actual ‘styles’ and tendencies in art and architecture (B.11)
4.14.1 Description and assessment
Understanding aesthetic perception of buildings and spaces through comparison to actual ‘styles’ and tendencies in art and architecture (B.11) KPI is assessed through the following indicator:
- Cognitive experience (B.11.1), which relates to the semantic aspects of aesthetic experience.
B.11 score, ranging from 0 to 100, is evaluated according to Equation (217):
(217)
Figure 101 provides B.11 performance classes and thresholds adopted in the self-assessment method. Hence, the four range of B.11 scores, equal to 0 ≤ B.11< 20, 20 ≤ B.11 < 50, 50 ≤ B.11< 80, and 80 ≤ B.11 ≤ 100, correspond to Low, Acceptable, Good, and Excellent performance class, respectively. It is highly recommended that B.11 attains as minimum the Acceptable performance class. This recommendation points out the project level of semantic and symbolic advancement in the context of contemporary architectural ‘styles’ and illustrate the project degree of commitment to promoting solutions specific to biophilic design.
Figure 101. B.11 performance classes and thresholds.

Source: JRC.
B.11 KPI and its corresponding indicator are designed to be implemented exclusively at building scale, including only newbuild projects with both residential and non-residential use. Furthermore, it is essential to note that the KPI and its corresponding indicator are not applicable to cultural heritage buildings.
4.14.2 Cognitive experience (B.11.1)
The cognitive experience (B.11.1) indicator refers to the cognitive (semantic), symbolic, and imaginative aspects of aesthetic experience. Since architecture is largely considered as a product of society and its perceptions and interpretations are variable over time, models developed within contemporary trends and 'styles' are assumed as the point of reference for newly designed buildings. The term 'style' is usually used to refer to a set of features, elements and principles that define the architectural practice in a given historical period. 'Style' is a way of categorising and identifying buildings based on their common linguistic form and cultural context. It is a reflection of the beliefs, values and artistic preferences of societies at a given time and place. However, contemporary architecture is formally diverse and has no defined 'style'. It is mainly dominated by contemporary modernism, which is a multi-faceted and pluralistic movement. The common denominator of this trend is a critical view of the intellectual basis of architecture. In addition to contemporary modernism, other crucial trends in present-day architecture are deconstructivism, eco-architecture, and different varieties of regionalism. In this context, the scientific research on the positive impact of nature on human wellbeing has confirmed the relevance gained in recent years by the concept of eco-architecture and the 'trend' of biophilic design (Kellert and Wilson, 1995), also resulting in line with the NEB philosophy. Biophilic design aims to build a satisfactory relationship between humans and the natural environment based on their evolutionary needs. Elements of biophilic design can be applied to architectural design regardless of the 'style', scale, and location of buildings.
The B.11.1 indicator assesses the issues of 'style' and 'tendency' through the following two metrics:
- Actual Styles (AS).
- Design Tendency (DT).
B.11.1 score, ranging from 0 to 100, is evaluated as the weighted average of the two aforementioned metric scores, according to Equation (218)
(218)
Actual style (AS) metric establishes the level of aesthetic perception of a new building project with reference to the model features of the 'style' used, among the following four contemporary basic 'styles':
- Eco-architecture is part of the sustainable design trend, manifested by a particular concern for the environment and the economic use of resources and materials throughout the building life cycle. The main objective of the eco-architecture design is to reduce the impact that construction sector produces on human health and its surroundings.
- Contemporary modernism refers to the repertoire of spatial forms and detailing of inter-war modernism, but does not refer to either the socio-political or urban ideas of the original modernism. Contemporary modernism stood in opposition to the eclecticism of postmodernism, seeking in geometric simplicity a suitable means of expression for the present. References to the philosophy of Piet Mondrian and Kazimir Malevich can be found in contemporary modernism. Mondrian was a pioneer of abstractionism, and his art was utopian and concerned with the search for a universal aesthetic. Abstractionism uses lines, shapes and colours to create compositions that can exist independently of real visual references. Mondrian's abstractionism consisted of creating rectangular grids and filling them with basic colours, and in its ideological layer it referred to classicism, Platonic values and Euclidean geometry. Malevich was the founder of suprematism, an artistic trend in which geometric forms, especially the square and the circle, formed the basis of artistic expression. Suprematism stood in opposition to constructivism and embodied a deeply anti-materialist and anti-utilitarian philosophy. The simplicity of the forms signified a new beginning. The so-called 'new rigorism', in which the form of a building is determined by its structure and functional layout, belongs to the contemporary modernist direction.
- Deconstructivism opposes the rationality of modernism and is characterised by the idea of fragmentation, and curvilinear shapes that serve to disrupt volumes and structures. It is inspired by the theory of chaos (specifically, the theory of catastrophes), the fractal geometry, the phenomenology and the concept of falsification. In the conceptual stage of design, the basic forms, shapes, surfaces, lines or ideas are ‘destroyed’ to open new creative opportunities for their deconstruction. Deconstructivist buildings freely play with forms and elements taken from different traditions, which change their previous meaning and function in new arrangements. Visually deconstruction often refers to catastrophes, such as bifurcation, folding, squeezing, tearing, cutting, breaking, etc. At the ideological level, the deconstructivism style is an attempt to translate the philosophy of Jacques Derrida into the language of building design (Wigley, 1997). However, critics of deconstructivism consider this style as a formal exercise without social meaning and deconstructed building forms are perceived as aggressive to the human senses (Curl, 2006).
- Regionalism is a trend in architectural design in which patterns are drawn from traditions linked to geographical and cultural contexts. Buildings are adapted to local conditions and climate, as well as use local materials. However, this trend does not rely on a process of copying, but of referring to the local building tradition, drawing lessons from observations while applying concepts, models and theories based on Environment-Behaviour Studies (Dahl, 2010). On an ideological level, regionalism uses a traditional language of forms and stands in opposition to uniformity. On the theoretical level, the style is underpinned by the theory of critical regionalism (Frampton, 1983), theories of cultural heritage preservation, as well as inspirations drawn from psychology (e.g. theories of physical and psychical well-being). Regionalism is not the equivalent of vernacular architecture, which is not designed by architects but constructed by local craftsmen using traditional materials and resources from the area in which a building is located (Vellinga, 2006).
To evaluate the AS metric, the assessor must first identify which ‘style’ is mostly used in a new building project to be self-assessed (Table 146), considering that each 'style' is characterised by specific basic features concerning different categories (i.e. shape, colour, texture and material, composition, spatial organisation, technological and structural solutions, and semantic and theoretical framework) to be compared with the design solutions adopted in the new building project to be self-assessed.
Table 146. Identification of the ‘style’ used in the project.
| Style | Selection |
| Select the most used ‘style’ in the project (single selection allowed) | |
| Eco-architecture | |
| Contemporary modernism | |
| Deconstructivism | |
| Regionalism | |
Source: JRC.
The actual style (AS) metric evaluates the extent to which the basic features of each of the aforementioned four contemporary styles are applied to a new building project, after identifying the style (among the four) mostly used in the new building project to be self-assessed (Table 146). Table 147 to Table 150 provide the rationale for the evaluation of the AS score related to each of the four styles. AS score can be equal to four different fixed values (i.e. 0, 40, 70, 100) indicative of four performance classes (i.e. low, acceptable, good, and excellent) of the attained aesthetic perception of a building project, noting though that metric performance classes are not used in the current version of the self-assessment method. Specifically, the acceptable and good performance indicate an increasing use of the features of a given ‘style’ in the building project. The excellent performance demonstrates the assessment of an in-depth, multi-faceted understanding and application of a given 'style', providing the observer of the architecture with a chance for a satisfying his/her cognitive experience.
Table 147. Actual style (AS) metric score - Eco‑architecture.
| Sub-metric | Score |
| If the eco-architecture style has been identified as the most used style of the project, select single value below. | |
| The new building project does not demonstrate any features of the eco-architecture style. | 0 (Low) |
The new building project is characterised by the following basic features of the eco-architecture style: Shape - Bio-based forms, shapes or patterns revealing reference to natural forms, shapes, organisms. Colour - Colours of natural materials (e.g. clay, earth, limestone, granite, wood). Textures and materials - Use of natural building and finishing materials Spatial organisation - Arrangement of spaces are determined by light and weather conditions. | 40 (Acceptable) |
The new building project is characterised by the following basic features of the eco-architecture style: Shapes - Shapes, patterns and composition show references to self-generating biological systems. Colour – Colour palette based on bright colours with gradation of their shades, and colours of natural materials. Textures and materials Use of natural building and finishing materials. Wood, stone, bamboo, recycled materials, re-used materials and elements of buildings exposed in visually appearing way, often rammed earth, hempcrete, compressed earthen blocks, adobe and ‘super-adobe’. Use of chiaroscuro to create building forms. Composition - Shapes and patterns are arranged into integral whole similar to a biological organism (e.g. plant) or non-organic natural structure (e.g. crystal, rock). Spatial organization - Space arrangements are defined by computer-based analyses of natural conditions (e.g. humidity, temperature, winds). Technological solutions Implementation of natural ventilation systems, whenever possible combined with advanced blue-green infrastructures. Green roofs and walls. Applying rules of bioclimatic design with primary focus on proper adjustment of buildings and spaces to local biological and climatic conditions with aim to use available contemporary technology to provide user with the highest level of comfort at the minimal environmental costs without compromising the rights of future generations to benefit from the same level of comfort. | 70 (Good) |
The new building project complies with the features of the eco-architecture style to attain the good performance and reflects at least three of the following additional features related to the ‘semantic and theoretical framework’ category: Semantic and theoretical framework Idea of the need to adopt a sustainable style of life. Design of built environment as an aesthetic, technological and moral issue. Reconsideration of vernacular architecture as a model for sustainable architecture. Biological and regenerative design aimed at natural ecosystem restoration by creating multilevel synergies with the built environment and implementing in the living systems in the architecture and enhancing the overall health of the ecosystem. Considering biological and environmental theories (e.g. theories of resilience and autopoietic systems) as new perspectives on environment and human-nature relationships. | 100 (Excellent) |
| AS metric score = Selected sub-metric score | AS = 0 or 40 or 70 or 100 |
Source: JRC.
Table 148. Actual style (AS) metric score - Contemporary modernism.
| Sub-metric | Score |
| If the contemporary modernism style has been identified as the most used style of the project, select single value below. | |
| The new building project does not demonstrate any features of the contemporary modernism style. | 0 (Low) |
The new building project is characterised by the following basic features of the contemporary modernism style: Shapes - Basic shapes derived from Euclidean geometry (e.g. rectangles, squares, cubes, spheres). Colour - Analogous colours (especially shades of white and grey, contrast of black/grey/white). Material and texture - Smooth surfaced and textures manifesting use of contemporary materials). Composition - Shapes and patterns arranged in repetitive modules. Spatial organization - Open-plan spaces. | 40 (Acceptable) |
The new building project is characterised by the following basic features of the contemporary modernism style: Shapes – Shapes and patterns based on proportion of the classical Greek and Roman architecture (e.g. golden section, Fibonacci sequence). Colours – Harmony based on monochromatic surfaces of analogous colours with elements of natural colours of building materials, with abundant introduction of green plants and the colour of water in buildings and spaces. Composition – Shapes and patterns are arranged in such a way as to create contrasts of vertical and horizontal lines and/or light and heavy masses Spatial organisation - Space arrangements facilitating use and circulation. | 70 (Good) |
The new building project complies with the features of the contemporary modernism style to attain good performance and reflects at least three of the following additional features related to the ‘semantic and theoretical framework’ category: Semantic and theoretical framework Ideas that “form follows function" and/or “less is more". Rationality as the basis for achieving harmony of design, space and function. Reference to architectural theories that attempted to impose a rational order on human life and the built environment (e.g. Le Corbusier, Walter Gropius, the Athens Charter). Artistic theories as sources of aesthetic ideals (e.g. abstractionism, neoplasticism, suprematism). | 100 (Excellent) |
| AS metric score = Selected sub-metric score | AS = 0 or 40 or 70 or 100 |
Source: JRC.
Table 149. Actual style (AS) metric score - Deconstructivism
| Sub-metric | Score |
| If the deconstructivism style has been identified as the most used style of the project, select single value below. | |
| The designed building does not demonstrate any features of the deconstructivism style. | 0 (Low) |
The new building project is characterised by the following basic features of the deconstructivism style: Shape - Shapes made of decomposed or shattered elements. Colour - Primary colours (black, red, grey, and white). Textures and materials - Light-reflecting surfaces and/or rusted surfaces. Composition – Shapes and surfaces juxtaposed one to another in a contrasting manner. Spatial organization Continuous spaces without clearly defined boundaries. | 40 (Acceptable) |
The new building project is characterised by the following basic features of the deconstructivism style: Shape - Shapes, patterns and composition imitating actions of physical forces or tensions (e.g. wave- or fold-like shapes). Colours – Limited palette based on colours contrasting with one another or with the colours dominant in the surroundings. Textures and materials - Reflective and/or rusty surfaces; contrasting textures and materials. Composition –Shapes and patterns are arranged in multiple-layers imposed one on another and/or masses juxtaposed one to another so as to imitate a collision of large bodies. Spatial organisation - Space arrangements disrupting users’ expectations and habits. Technological and structural solutions – Solutions allowing for constructing slanted walls and/or walls and roofs based on non-Euclidean geometry (e.g. cantilevered constructions, parametric design). | 70 (Good) |
The new building project complies with the features of the deconstructivism style to attain the good performance, and reflects at least three of the following additional features related to the ‘semantic and theoretical framework’ category: Semantic and theoretical framework Idea that cultural canons, standards, or values are relative. Idea that architecture is a powerful tool to create new lifestyles. A contradiction to the ideals of modernism. Theories of architecture as a means of reinterpreting (deconstructing) users' understanding of space in social and physical terms (e.g. theories of Ch. Jenck, S. Holl). Philosophical theories (e.g. J. Derrida's deconstruction) or scientific theories (e.g. catastrophe theory, entropy theory) that provide the basis for a new view of the social and natural world. | 100 (Excellent) |
| AS metric score = Selected sub-metric score | AS = 0 or 40 or 70 or 100 |
Source: JRC.
Table 150. Actual style (AS) metric score - Regionalism.
| Sub-metric | Score |
| If the regionalism style has been identified as the project style, select single value below. | |
| The new building project does not demonstrate any features of the regionalism style. | 0 (Low) |
The new building project is characterised by the following basic features of the regionalism style: Shape - Shapes and patterns continuous with the shapes of the cultural or natural surrounding landscape Colour - Colours continuous with the colours of the cultural or natural surrounding landscape. Textures and materials - Use of local materials (e.g. clay, stone, wood). Composition - Forms and colours arranged to create unity (harmony) with the surroundings. Spatial organization – Imitation of space arrangements typical for the local (vernacular) architectural tradition. | 40 (Acceptable) |
The new building project is characterised by the following basic features of the regionalism style: Shape - Shapes and patterns imitating shapes and patterns typical for the local (vernacular) architectural tradition. Colours – Palette of colours typical for the local (vernacular) architectural tradition, as well as natural and cultural landscape. Textures and materials - Local materials (e.g. clay, stone, and wood), abundant introduction of greenery, and local patterns (e.g. wood carvings, ceramics, etc.). Composition - Shapes are arranged to enhance a multisensory experience of the design and its surroundings (e.g. solutions using light/shade effects or aimed at creating a pleasant soundscape). Spatial organisation - Space arrangements create unity between the building and its surroundings (e.g. through the use of porticos, large windows, terraces). | 70 (Good) |
The new building project complies with the features of the regionalism style to attain the good performance, and reflects at least three of the following additional features related to the ‘semantic and theoretical framework’ category: Idea that it is necessary to appreciate local cultural or natural landscape. Idea that genius loci is to be respected. Theories of architecture as a means to understand the value of the experience of local culture and landscape (e.g. K. Frampton’s, J. Pallasmaa’s, P. Zumthor’s theories). Psychological or philosophical theories (e.g. Ch. Norbeg-Schulz’s phenomenology) or theories of cultural and natural heritage management and preservations as theories offering new insights into the understanding of how people relate to places and spaces. | 100 (Excellent) |
| AS metric score = Selected sub-metric score | AS = 0 or 40 or 70 or 100 |
Source: JRC.
Design tendency (DT) metric refers to actual trends that, apart from their aesthetic value, measurably contribute to the well‑being of humans and their relationship with the natural environment. These trends are clearly outlined in various ecological approaches and biophilic design, which relates to the biological tendency of humans to stay in relationship with nature. Research shows that the use of the biophilic approach to design the urban environment has a positive impact on the well-being of the natural environment (Kellert et al., 2008).
The design tendency metric relies on the biophilic approach as relevant design trend and assesses whether a new building project includes nine design solutions strictly related to the biophilic design approach. The presence or absence of each of the nine design solutions in a project provides nine partial scores, each corresponding to a positive (in the case of presence) or a zero (in the case of absence) value, which are assigned according to the rationale presented in Table 151. The sum of the nine partial scores, providing the design tendency metric score, ranges from 0 (i.e. absence of all biophilic design solutions) to 100 (presence of all biophilic design solutions).
Table 151. Design tendency (DT) metric score.
| Sub-metric | Score |
| Indicate the presence, i.e. yes, or absence, i.e. no, of each of the nine design solutions below and sum the corresponding nine scores | |
The project includes the following design solutions related to biophilic design:
|
If yes, + 15. If no, 0. If yes, + 15. If no, 0. If yes, + 15. If no, 0.
If yes, + 15. If no, 0. If yes, + 8. If no, 0.
If yes, + 8. If no, 0. If yes, + 8. If no, 0.
If yes, + 8. If no, 0.
If yes, + 8. If no, 0. |
| Design tendency (DT) metric score = Σ (sub-metric scores = ‘yes’, ‘no’ scores) | 0 ≤ DT ≤ 100 |
Source: JRC
4.14.3 Example (B.11)
The same building considered for the evaluation of B.7 KPI (Section 4.10.4) is also used for the evaluation of B.11 KPI. The building description is provided again in the following to facilitate the evaluation of B.11. A free-standing public building, newly constructed in a historic environment is considered. The four-storey building houses a contemporary art museum, shops, restaurants and artist studios. The scale of the building was adapted to the neighbouring buildings. The building is designed as a quadrangle with an inner courtyard, which is open to the general public (not exclusively to the direct users of the building). The courtyard forms part of the public space and the ground floor of the building is largely open (the structural elements of the building are visible). The courtyard features a green area and a water body, corresponding to a fountain (other water bodies can be a decorative reservoir, small pool, etc.), as well as an open-air amphitheatre and an outdoor art exhibition. The building exhibits several features of the contemporary modernism style, with its façades heavily glazed, rectangular forms, monochromatic colours specific for the building materials used. Additionally, a number of pro-ecological solutions in line with the biophilic design approach can be observed, including exposure to natural light (diffused due to the building function), greenery in the interiors, natural materials in the interior arrangement, vertical green systems (VGS) and water body for evaporative cooling.
The evaluation of B.11 depends on the score of the cognitive experience (B.11.1) indicator, which is evaluated through the following two metrics: (i) actual styles (AS) and (ii) design tendency (DT).
Actual style metric is evaluated by comparing the design solutions of the example building to the basic features of the contemporary modernism style, according to the sub-metrics in Table 148, as the building design mainly reflects the contemporary modernism style (Table 146). Based on the comparison results, the actual style score is equal to 70.
Design Tendency metric is evaluated according to the sub-metrics in Table 151. The design tendency score is based on the presence of seven out of nine design solutions related to the biophilic design approach, as reported in Table 152.
Table 152. Example of design tendency evaluation
| Sub-metric | Score |
| Indicate the presence, i.e. yes, or absence, i.e. no, of each of the nine design solutions below and sum the corresponding nine scores | |
The project includes the following design solutions related to biophilic design:
|
Yes, + 15 Yes, + 15 Yes, + 15
Yes, + 15. No, 0
Yes, + 8. No, 0
Yes, + 8.
Yes, + 8. |
| Design tendency (DT) metric score = Σ (sub-metric scores = ‘yes’, ‘no’ scores) | DT = 84 |
Source: JRC
Having evaluated the score for each metric, B.11.1 score is estimated according to Equation (218). B.11.1 corresponds to B.11 score (Equation (217)), which is estimated equal to 78.4, thus corresponding to a Good performance class (Figure 101), as reported in Table 153.
Table 153. Example of B.11.1 and B.11 evaluation.
| Indicator | B.11.1 |
| Indicator score | = 0.40 ∙ 70 + 0.6 ∙ 84 = 78.4 |
| B.11 score | = 1 ∙ 78.4 = 78.4 |
| B.11 performance class | Good |
| B.11 performance class score (PCSB.11) | 70 |
Source: JRC.