4.5.1 Description and assessment
Under Quality of design and delivery KPI (B.2), the following indicators are assessed:
- Competencies of design team and contractors (B.2.1): the extent to which the project team has relevant skills and experience in delivering improved environmental performance and quality.
- Responsible material sourcing (B.2.2): the extent to which purchased construction products contribute to lower levels of negative environmental, economic and social impact.
- Compliance with material efficiency opportunities (B.2.3): the extent to which the design achieves more efficient use of material resources in structural elements.
In the general case when all indicators are considered, B.2 score is evaluated as follows:
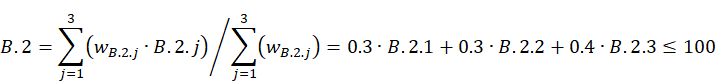
(130)
The first indicator (B.2.1) focuses on the competencies necessary to deliver an environmentally improved product. With respect to the requirements in a standard tender process, this criterion values experience in specific technical areas relevant to the sustainability of the final outcomes. This includes expertise in managing technical innovations and utilising multi-criteria green/sustainability or resilience certification schemes, given their increasing prevalence. A competent team is expected to select and specify solutions that align with environmental criteria. The criterion does not aim to exclude companies with less experience and rather encourages their participation in projects with high environmental performance requirements. The goal is to balance risks and foster the project success by ensuring that design and construction teams comprise experienced professionals.
The second indicator (B.2.2) shifts the focus from the procurement of services to the procurement of goods. It promotes the specification and purchase of products with responsible sourcing certification over similar products without certification. Embedding ecological aspects in procurement policies and practices is expected to contribute to sustainable development (ISO, 2017c) and this indicator measures the commitment of the involved organisations to the principles of responsible sourcing.
The third indicator (B.2.3) evaluates whether a project is overdesigned by assessing the quantity of sourced materials in structural elements, thus promoting the optimisation and reduction of embodied resources. Load-bearing systems typically contain an important part of the mass and carbon embodied into the building, which is becoming more relevant also in terms of carbon emissions due to the improvement in the reduction of operational carbon (Röck et al., 2020). Therefore, this indicator provides an evaluation of the structural resource use intensity in the adopted design solutions. To simplify the quantification of this indicator, only floor systems are considered since they typically embody most of the building mass (van der Lugt et al, 2023) and are subjected to well-known loading conditions that are not significantly affected by exogenous factors.
Figure 51 provides the B.2 KPI thresholds adopted in the self-assessment method.
Figure 51. B.2 performance classes and thresholds.

Source: JRC.
The KPI and its three indicators are designed to be implemented at all project scales, types and main uses (Table 47). The assessment of B.2.1 requires the identification of the main actors involved in the delivery and operational phases, therefore, it is not affected by the project classification (i.e. scale, type main use). B.2.2 and B.2.3 are evaluated from an estimation of the BoQ and BoM for the whole building (B.2.2) and the floor systems (B.2.3). To make and manage a harmonised estimate and classification of BoQ and BoM during the design stage, the Level(s) inventory template (Donatello et al., 2021) may be adopted. B.2.2 and B.2.3 evaluation is affected by the project scale and type.
For renovation projects, there are no significant alterations in the assessment compared to newbuild projects for B.2.2 that focuses on new products sourced for the proposed works. For renovation projects, B.2.3 is evaluated only when changes are made to the floor systems. Accordingly, when renovation projects do not include alterations to the floor system, B.2.3 is omitted according to Equation (131).
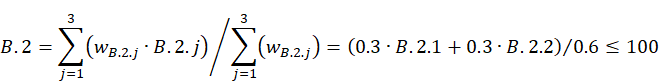
(131)
When a project, classified into the neighbourhood or urban scale, involves several buildings with distinct design characteristics, thus likely leading to different indicator scores for each of them, the evaluation of B.2.2 and B.2.3 shall be carried out by identifying representative samples of buildings with similar design features. For each of these representative building designs, a separate assessment should be performed. The overall score per indicator is then estimated as a weighted average of the separate assessment scores, with the weights obtained from the relative occurrence of each building design (in terms of number of buildings, built area, or other features). For example, when a neighbourhood/urban project includes multiple floor system types, B.2.3 is separately calculated for each system and the overall indicator score is determined as a weighted average of the different floor system scores, with the weights based on the area of each floor type as a percentage of the total gross internal floor area.
When a renovation project, classified into the neighbourhood or urban scale, includes buildings with modified floor systems and buildings without such modifications, the two cases must be assessed separately, as two distinct projects. This is the same approach as the one followed when a neighbourhood/urban scale project includes both types (newbuild, renovation) and/or uses (residential, non-residential) (Section 2.3.2). In all these cases the project should be assessed as multiple ones addressing separately the different classes (e.g. newbuild and residential; newbuild and non-residential; renovation and residential; renovation and non-residential) at the scale of the complete project.
The evaluation of the indicators is conducted by the design team, comprising architects, structural engineers, and service engineers, potentially seeking the advice of product manufacturers, main and specialist contractors, to ensure the traceability of products and materials across their supply chains (B.2.2) or identify feasible alternatives to optimise the design of the floor systems (B.2.3).
The assessment requires the identification and collection of the building design plans, architectural and structural design drawings, service plans, BoQ and BoM for the whole building or the renovated section of the building. For B.2.1, the CVs of the involved parties, official declarations and information related to relevant contracts in the previous years may be necessary to the self-assessor to carry out the indicator quantification.
4.5.2 Competencies of design team and contractors (B.2.1)
The competencies of design team and contractors indicator (B.2.1) is evaluated through a dimensionless score, varying between 0 and 100, based on the PPD (Directive, 2014) and the GPP (COM, 2008) project team competency criteria. The GPP criteria have been defined for office building design, construction and management; however, they are considered hereafter as generally applicable to any building type.
This indicator seeks to ensure that all parties involved in the delivery phase (i.e. design, construction and commissioning), and operational phase (i.e. operations and maintenance), have relevant competencies and experience in each of the technical areas that are relevant to their contractual obligations. Following the GPP approach, four main actors are considered separately due to their distinct roles, differences in the contractual relationships and required competencies: (i) project manager, (ii) architect, consultant and/or design team, (iii) main contractor and specialist contractors, (iv) design, build and operate (DBO) contractors and property developers.
The qualitative requirements for contract awarding envisaged by the PPD are categorised as: (i) suitability to pursue the professional activity, (ii) economic and financial standing, (iii) technical and professional ability. The evaluation of these qualitative requirements within a tender procedure is a complex task, often entrusted to a panel with sufficient knowledge and experience to assess competing contractors effectively. Moreover, specific criteria and minimum requirements may be set by national legislation, depending on the size and characteristics of the projects. Therefore, for the scope of the self-assessment tool, a simplified procedure is proposed.
The suitability to pursue the professional activity of any party involved is evaluated with membership in national professional or trade registers. A list of relevant registers and corresponding declarations and certificates is provided in Annex XI of the Directive on public procurement (Directive, 2014).
Requirements concerning economic and financial standing aim to ensure that actors have the necessary economic and financial capacity to execute the contract. The combined capacity of the actors involved is demonstrated, for self-assessment purposes, through a turnover ratio (i.e. ratio of the annual revenue to the expected annual contract value) at least unitary for the three financial years previous to the contract. Moreover, the actors should be protected against third-party claims through an appropriate level of professional risk indemnity insurance. On the other hand, technical and professional ability ensures that actors have adequate human and technical resources and experience to perform the contract to an appropriate quality standard. Combined compliance of the parties involved with these requirements is achieved by holding satisfactory experience of at least four works of a similar size, nature and complexity performed in the five previous years. Project similarity is evaluated in terms of the percentage of the estimated project value. Additionally, an adequate average annual manpower employed in the previous years and specific tools, plant and other technical equipment are necessary and at least one member of the project management or design team must have at least seven years of experience in delivering similar projects.
GPP shifts the focus of the assessment from the three classes of requirements to more environmentally related factors, defining two increasing levels of ambition. The core criteria aim to optimise the trade-off between capacity and economic investments, since the inclusion of green criteria typically entails higher upfront costs compared to standard solutions. Comprehensive criteria, instead, aim at higher innovation goals and more competencies are required. According to GPP, the actors should have relevant competencies and experience in each of the areas that are listed in Table 51, excluding the ones that are not relevant to the specific contract.
Table 51. Competencies and experience required of the main actors involved.
| Project manager | |
| Core criteria | Comprehensive criteria |
| Beside core criteria, project manager shall have relevant competencies and experience in each of the following:
|
| Design team | |
| Core criteria | Comprehensive criteria |
| Besides core criteria, architect, consultant and/or design team consortium shall have relevant competencies and experience in each of the following:
|
| Main and specialist contractors | |
| Core criteria | Comprehensive criteria |
| Besides core criteria, main and specialist contractors shall have relevant experience in each of the following:
|
| Design, build and operate (DBO) contractors, and property developers | |
| Core criteria | Comprehensive criteria |
| Besides core criteria, DBO contractors or property developers shall have relevant experience in management of design teams and/or main contractors to obtain ratings according to multi-criteria building assessment and certification schemes. |
Source: Adapted from Dodd et al. (2016).
In the case of design and build contracts, the design team employed should be assessed under the design team criteria. Additionally, when the DBO contractors or property developers operate as facility managers of the building, they shall have certified experience, such as ISO 50001 (ISO, 2018a) or equivalent, in implementing energy management systems (Dodd et al., 2016).
Given the aforementioned PPD and GPP criteria, the scores are assigned according to the rationale indicated in Table 52. The sum of the points cannot exceed 100. For the assessment, the presence in the project team of actors who meet any one of the exclusion rules defined in Directive (2014) automatically results in a value of 0 for the indicator.
Table 52. B.2.1 score.
| Metric | Score1 |
| Select a single value below: | |
| Project team comprises at least one actor meeting any of the exclusion criteria of Public Procurement Directive (PPD) (Directive, 2014) | B.2.1 = 0, No further points to be added. |
| No actor of the project team meets any of the exclusion criteria of PPD | Check next metrics |
| Select multiple values below: | |
| Project manager or design team is qualified and has economic and financial standing as well as technical and professional ability according to PPD. | +25 |
| Main or DBO contractors has suitability, economic and financial standing and technical and professional ability according to PPD. | +25 |
| Select a single value below: | |
Project manager meets GPP core criteria. Project manager meets GPP comprehensive criteria. | +15 +30 |
| Select a single value below: | |
Design team meets GPP core criteria. Design team meets GPP comprehensive criteria. | +10 +20 |
| Select a single value below: | |
Main or DBO contractors meets GPP core criteria. Main or DBO contractors meets GPP comprehensive criteria. | +15 +30 |
| Indicator score = Σ(metric scores) | ≤ 100 |
1 If no metric value is satisfied in a single or multiple selection, the assigned score is zero (0).
Source: JRC.
Figure 52 shows the indicator thresholds used to link indicator scores with performance classes for B.2.1. While these thresholds and performance classes are not directly applied in the evaluation of KPI and dimension scores and performance classes, they are included here to assist users in determining appropriate performance levels for specific project aspects and to offer clear guidance on their improvement.
Figure 52. B.2.1 indicative performance classes and thresholds.

Source: JRC.
4.5.3 Responsible material sourcing (B.2.2)
The responsible material sourcing indicator is quantitatively evaluated as the percentage of construction products from traceable and certified sources. Thus, the indicator varies between 0 and 100. The indicator aims at lowering the levels of negative environmental, economic and social impact, across the supply chain of products, including extraction, processing and manufacture, adopting sustainable development principles and practices in the provision, procurement and traceability of construction materials and components.
To eliminate the use of construction products originating from non-legal sources, a prerequisite of this indicator is that all components, parts and materials integrated in the building must be legally sourced. Failing to meet this requirement leads to a score equal to zero. This is particularly relevant for wood and wood-based products used permanently in the building, and temporarily during construction (e.g. formwork materials). These must be legally harvested and traded as demonstrated through certification schemes, such as those of the Forest Stewardship Council (FSC), the Programme for the Endorsement of Forest Certification (PEFC), the Forest Law Enforcement Governance and Trade (FLEGT), the European Union Timber Regulations (EUTR) or equivalent. Additional certificates may be needed in case of endangered species according to the Convention on International Trade in Endangered Species (CITES) (Dodd et al., 2016).
The BRE Environmental and Sustainability standard (BRE, 2016) provides a comprehensive framework for the assessment of sustainability aspects in the management and procurement practices of an organisation, defining a set of criteria with increasing performance levels. In the current absence of a European standardised method, an approach based on the supply chain management requirements reported in the BRE standard is adopted here as a transitional strategy for the assessment of the responsible material sourcing.
Based on the adopted approach, the assessment is conducted following the identification of the relevant building elements, components, parts, and materials, together with their respective quantities. Within the elements of BoQ, products are identified that are traceable through the supply chain and have an environmental management system in place. Quantities can be measured according to masses, volumes, or values, depending on the most appropriate measure for the assessed product. Consistency is crucial, and when the evaluation aims at driving the decision-making regarding multiple design solutions, the same measure should be consistently adopted in all alternatives.
In the self-assessment tool, products to be considered traceable and responsibly sourced require organisations involved at each stage of their supply chain, including raw material extraction and primary material production, to be certified by an accredited organisation according to ISO 9001 (ISO, 2024b). Moreover, such products must present an environmental management system certified by an accredited organisation according to standards such as ISO 14001 (ISO, 2024a), EU Eco-Management and Audit Scheme (EMAS), FSC and PEFC for wood and wood-based products, among others. Products and materials that are directly reused, fulfil responsible sourcing criteria even without a certification, whereas recycled and recovered ones require a certification for the reprocessing operations. In some cases, it is not possible to ensure the traceability across all the supply chain. In these cases, a possible future improvement of the assessment method consists in considering a different weight depending on the possibility of defining the certification of all or only the major aspects of processing, as currently adopted by some of the BREEAM ([1]) certification schemes.
Recommended thresholds for the percentage of construction products from responsible sourcing may depend on local, regional and/or national market factors (considering the scale of the project). Referring to wood and wood-based materials, GPP sets 25% as an easily achievable target and 70% as a more ambitious goal for public authorities (Dodd et al., 2016). The BRE Environmental and Sustainability standard (BRE, 2016), instead, sets three increasing levels at 60%, 75% and 90%. Considering these sources, Figure 53 shows the indicator thresholds used to link indicator scores with performance classes for B.2.2 in the NEB self-assessment method. While these thresholds and performance classes are not directly applied in the evaluation of KPI and dimension scores and performance classes, they are included here to assist users in determining appropriate performance levels for specific project aspects and to offer clear guidance on their improvement.
Figure 53. B.2.2 indicative performance classes and thresholds.

Source: JRC.
4.5.4 Compliance with material efficiency opportunities (B.2.3)
The compliance with material efficiency opportunities is quantitatively evaluated through a dimensionless score, based on the material weight per floor area, which is denoted as g (kN/m2). This ratio serves as a measure of ‘lightness’ of structures and anthropogenic (technosphere) mass flows.
Specifically, the assessment of B.2.3 focuses on the horizontal structural systems of buildings (i.e. beams and slabs). The influence of foundations, columns and walls is omitted. The design of these structural components depends significantly on a multitude of exogenous factors such as soil properties, ground water levels and expected actions, which would make the evaluation impractical. Importantly, floor slabs typically embody most of the building mass, estimated between 55 and 65% (van der Lugt et al, 2023), and thus offer a prime opportunity for resource optimisation. In addition, the design of floor systems, in most cases is based on established and well-known loading conditions that are not significantly affected from exogenous factors. Floor slabs are integral components of the structure, providing support for occupants, furnishings, and equipment. However, conventional floor slab designs may result in excessive material use, particularly in buildings with large spans or irregular shapes.
B.2.3 indicator aims at the adoption and implementation of strategies to ensure a reduction of material use in the horizontal structural elements. This, in turn, has a beneficial impact in terms of carbon emissions, resource consumption and energy embodied in the building. The estimation of embodied GHG emission into products and processes across the whole life cycle of the building is covered by S.3.2 indicator in the Sustainability dimension, complementing this indicator towards the efficient use of materials and resources.
Preliminary benchmarks have been collected from recent studies (Hart et al., 2021; Svatoš-Ražnjević et al., 2022; Belizario-Silva et al., 2024), which focused on the evaluation of superstructure systems for a variety of material options. Additional information was taken from a survey of 518 buildings (De Wolf et al., 2020), which reports material use intensity considering different structural systems. Since the identified thresholds are not well established, an independent investigation has been conducted for the development of this indicator.
According to this investigation, material usage estimation was carried out for reinforced concrete, timber, and composite floor slabs. Selected construction technologies for each construction material are briefly described in Table A. 1. The selection was based on the degree of maturity of the construction technology, ease of construction and common use in practice.
A multi-span sample area (28 · 21 m = 588 m2) and two different layouts for supports were considered, as illustrated in Figure 54. For reinforced concrete and composite slabs, spans of 7 · 7 m and 7 · 14 m were considered, respectively, while for timber slabs, the spans were reduced to 6 · 6 m and 6 · 12 m in line with existing construction technologies and good design practice (Schneider et al., 2024). For each construction technology, the slab self-weight along with additional permanent (g2) and imposed loads (q) were estimated. Loading scenarios with g2 + q ranging from 4 to 7 kN/m2 were considered as lower and upper bounds respectively, complying with the design prescriptions of Eurocode 1 – Part 1-1-1 (CEN, 2002a) for most residential and commercial buildings. Assumptions for the material properties were made for each slab configuration. The material designation intends not only to ensure effectiveness for each floor construction technology, but also reflect a typical implementation, avoiding material classes addressed to special structures. A minimum storey height of 2.6 m and a minimum structural fire resistance class of R60 (CEN, 2002b) were considered for all combinations of material, support layout and construction technologies.
Figure 54. Slab support layout: (a) A · B = 7 · 14 m for reinforced concrete and composite systems and A · B = 6 · 12 m for timber systems; (b) A · B = 7 · 7 m for reinforced concrete and composite systems and A · B = 6 · 6 m for timber systems.
(a) 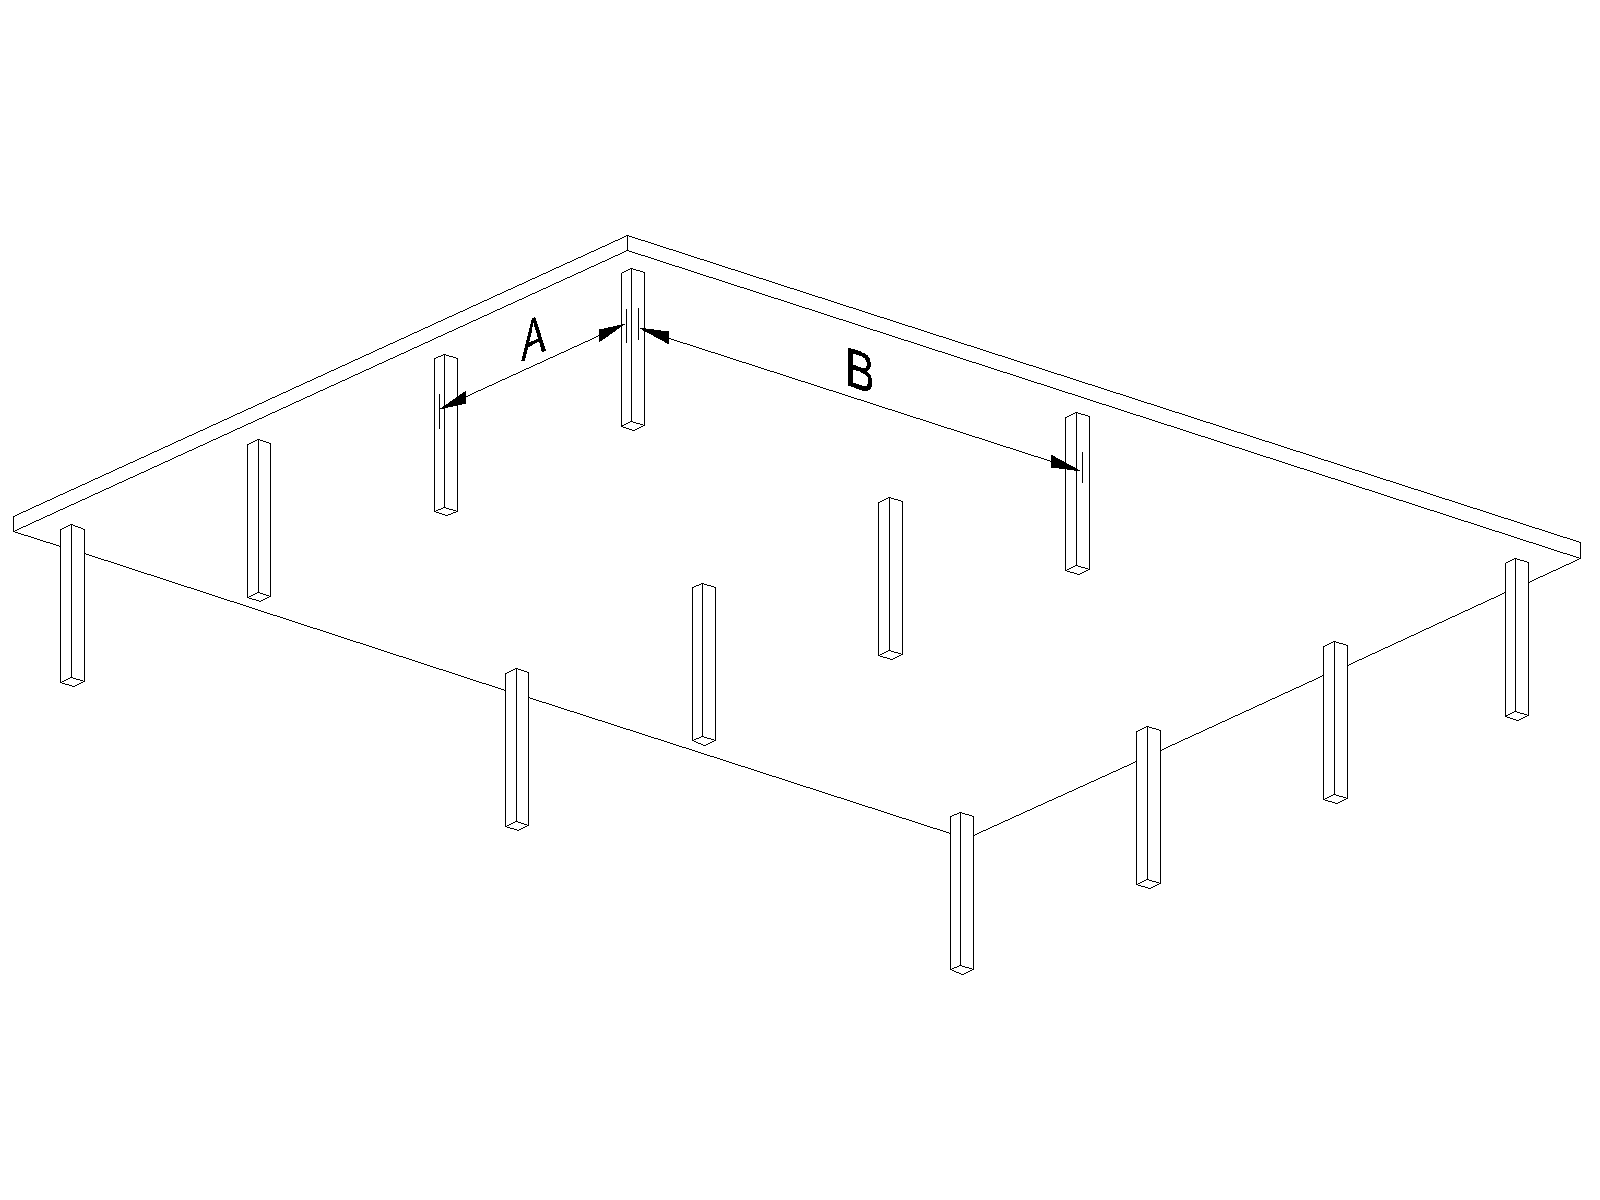 | (b) 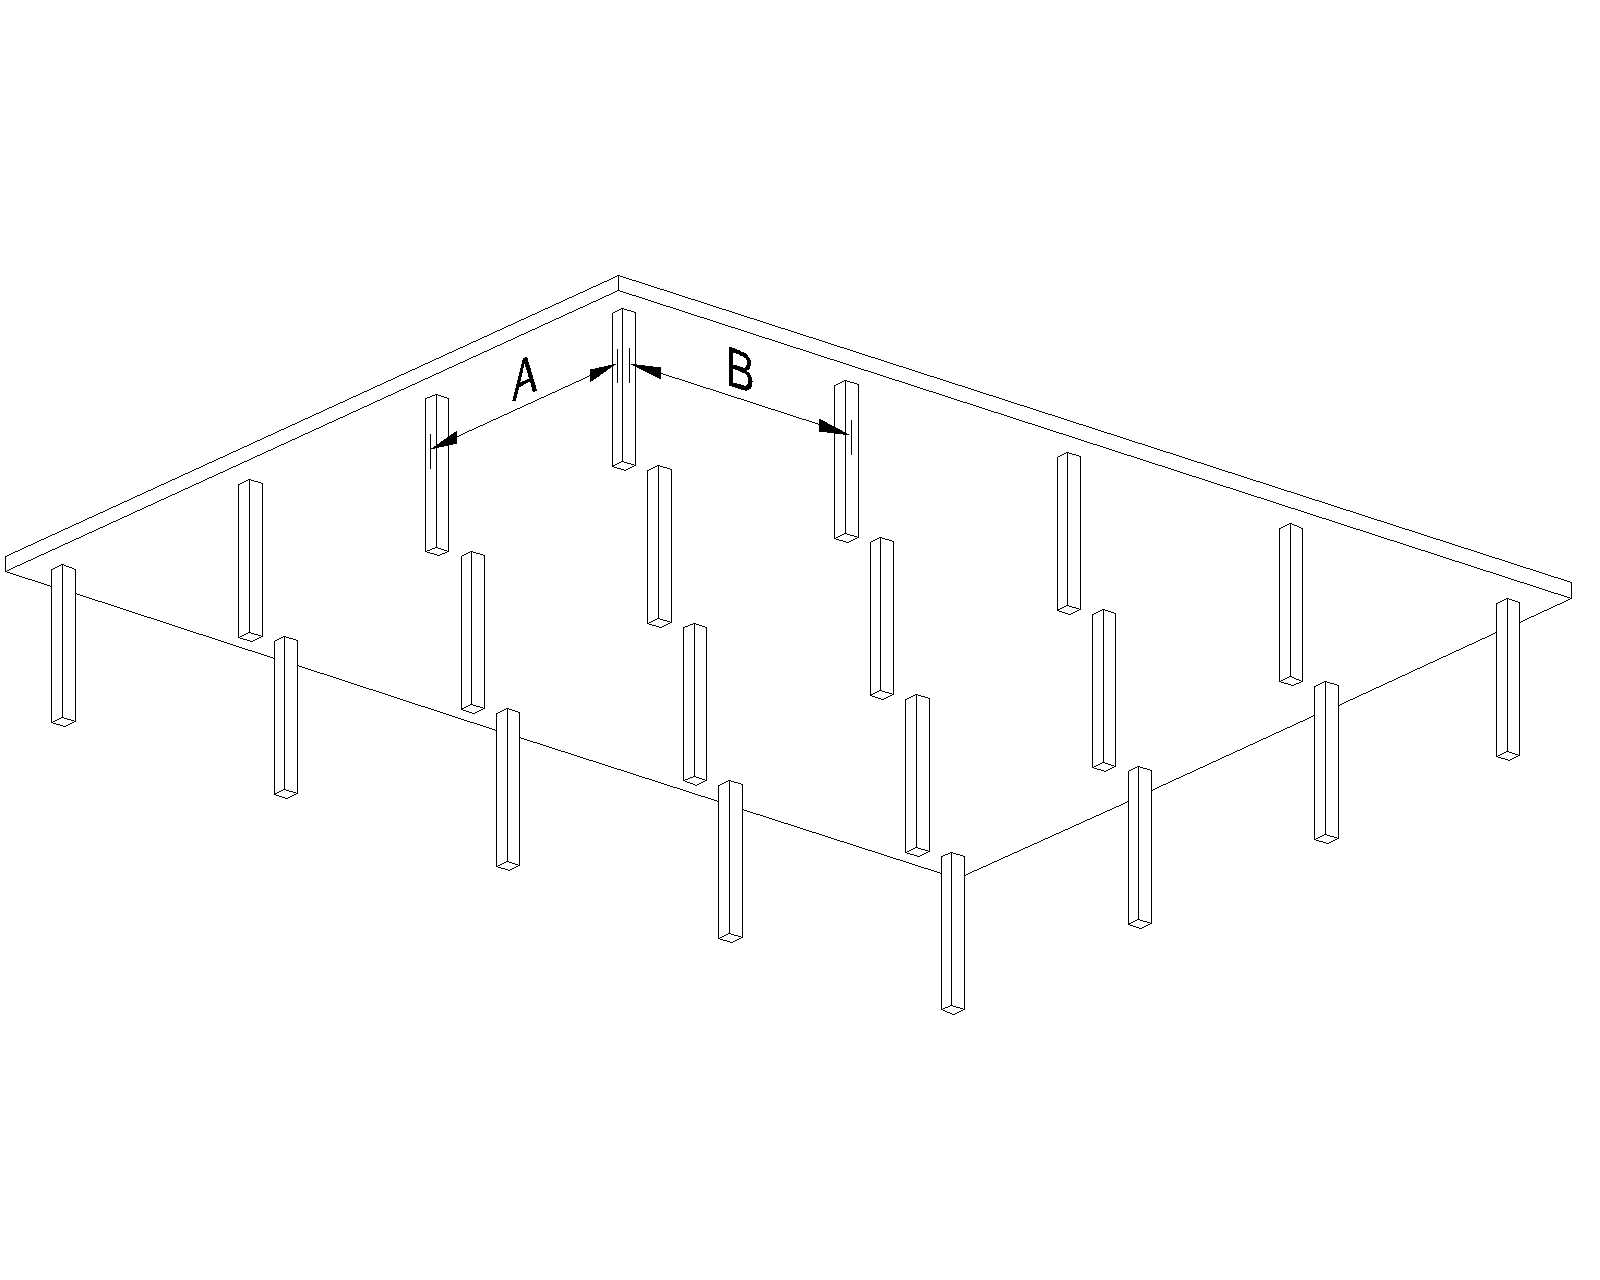 |
Source: JRC.
The investigation resulted in detailed maps of floor slab self-weight versus the employed construction technology and main span, as presented in the box plot of Figure 55 for reinforced concrete, Figure 56 for timber, and Figure 57 for composite floor systems. The floor slab cross-sections are detailed in Table A. 1.
Figure 55. Structural resource intensity for concrete slabs (C25/30, C50/60).
Self-weight g [kN/m2]
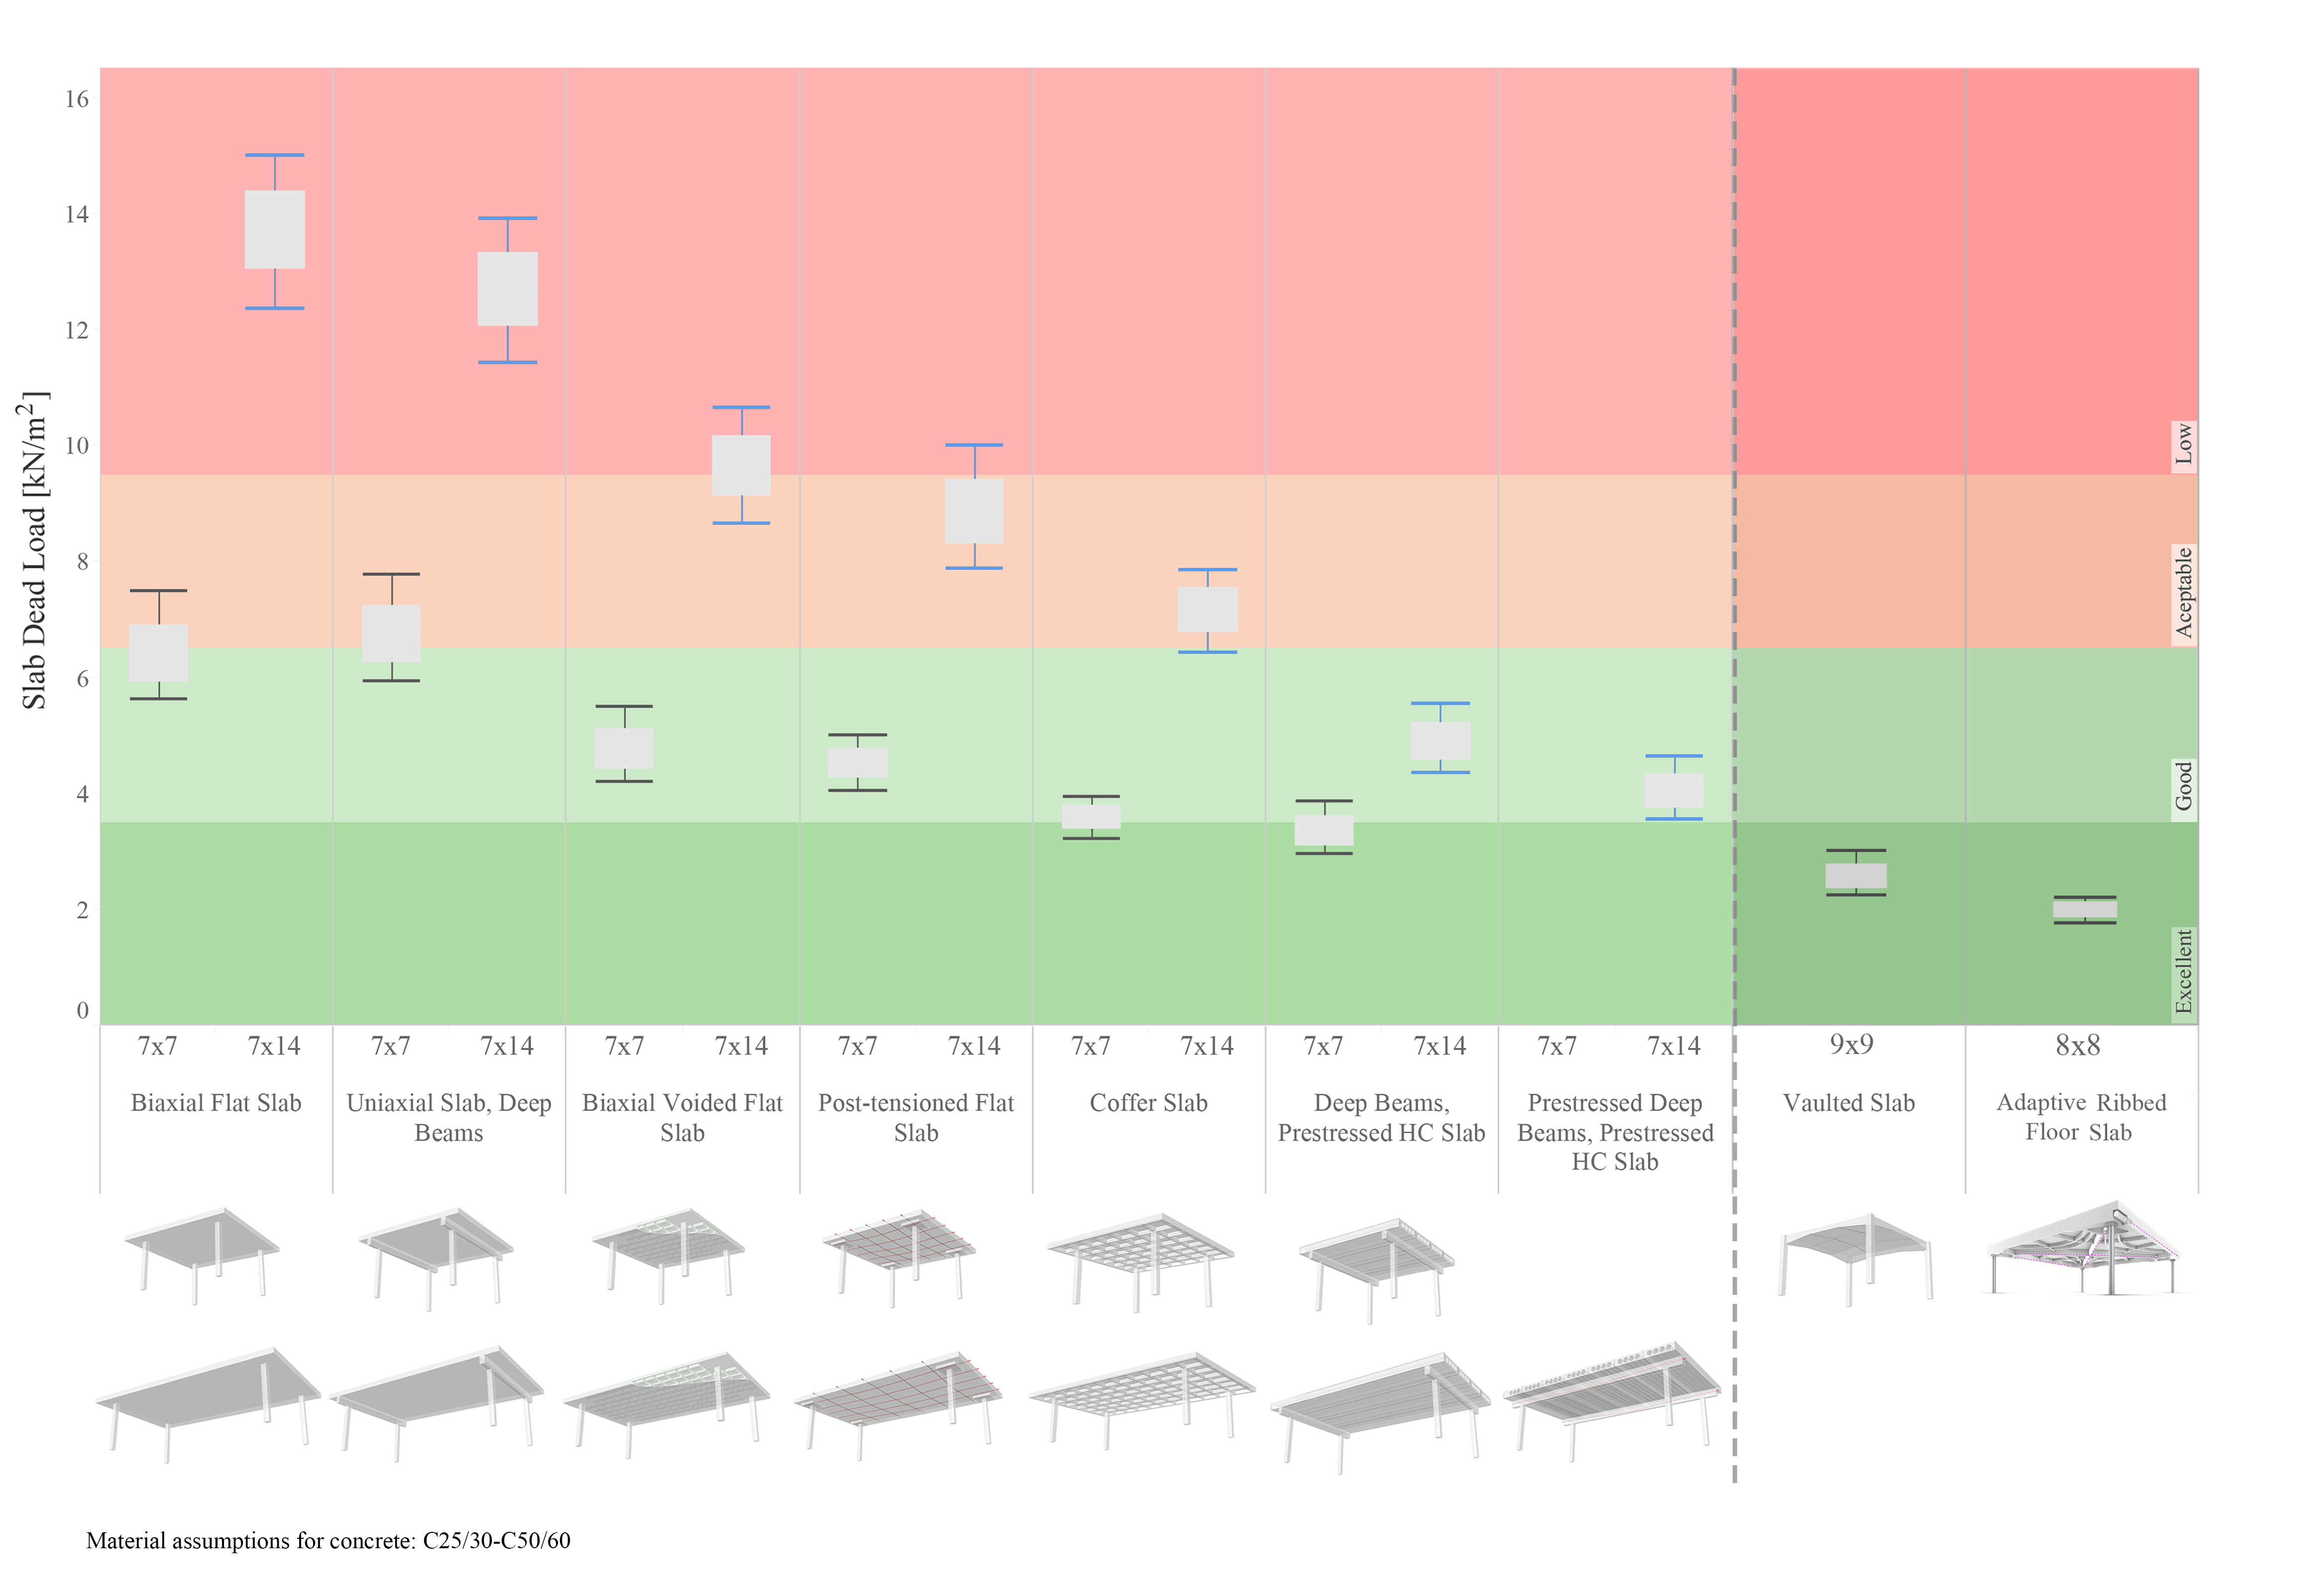
Source: JRC
Figure 56. Structural resource intensity for timber slabs (C24, GL24h, GL28h, LVL).
Self-weight g [kN/m2]
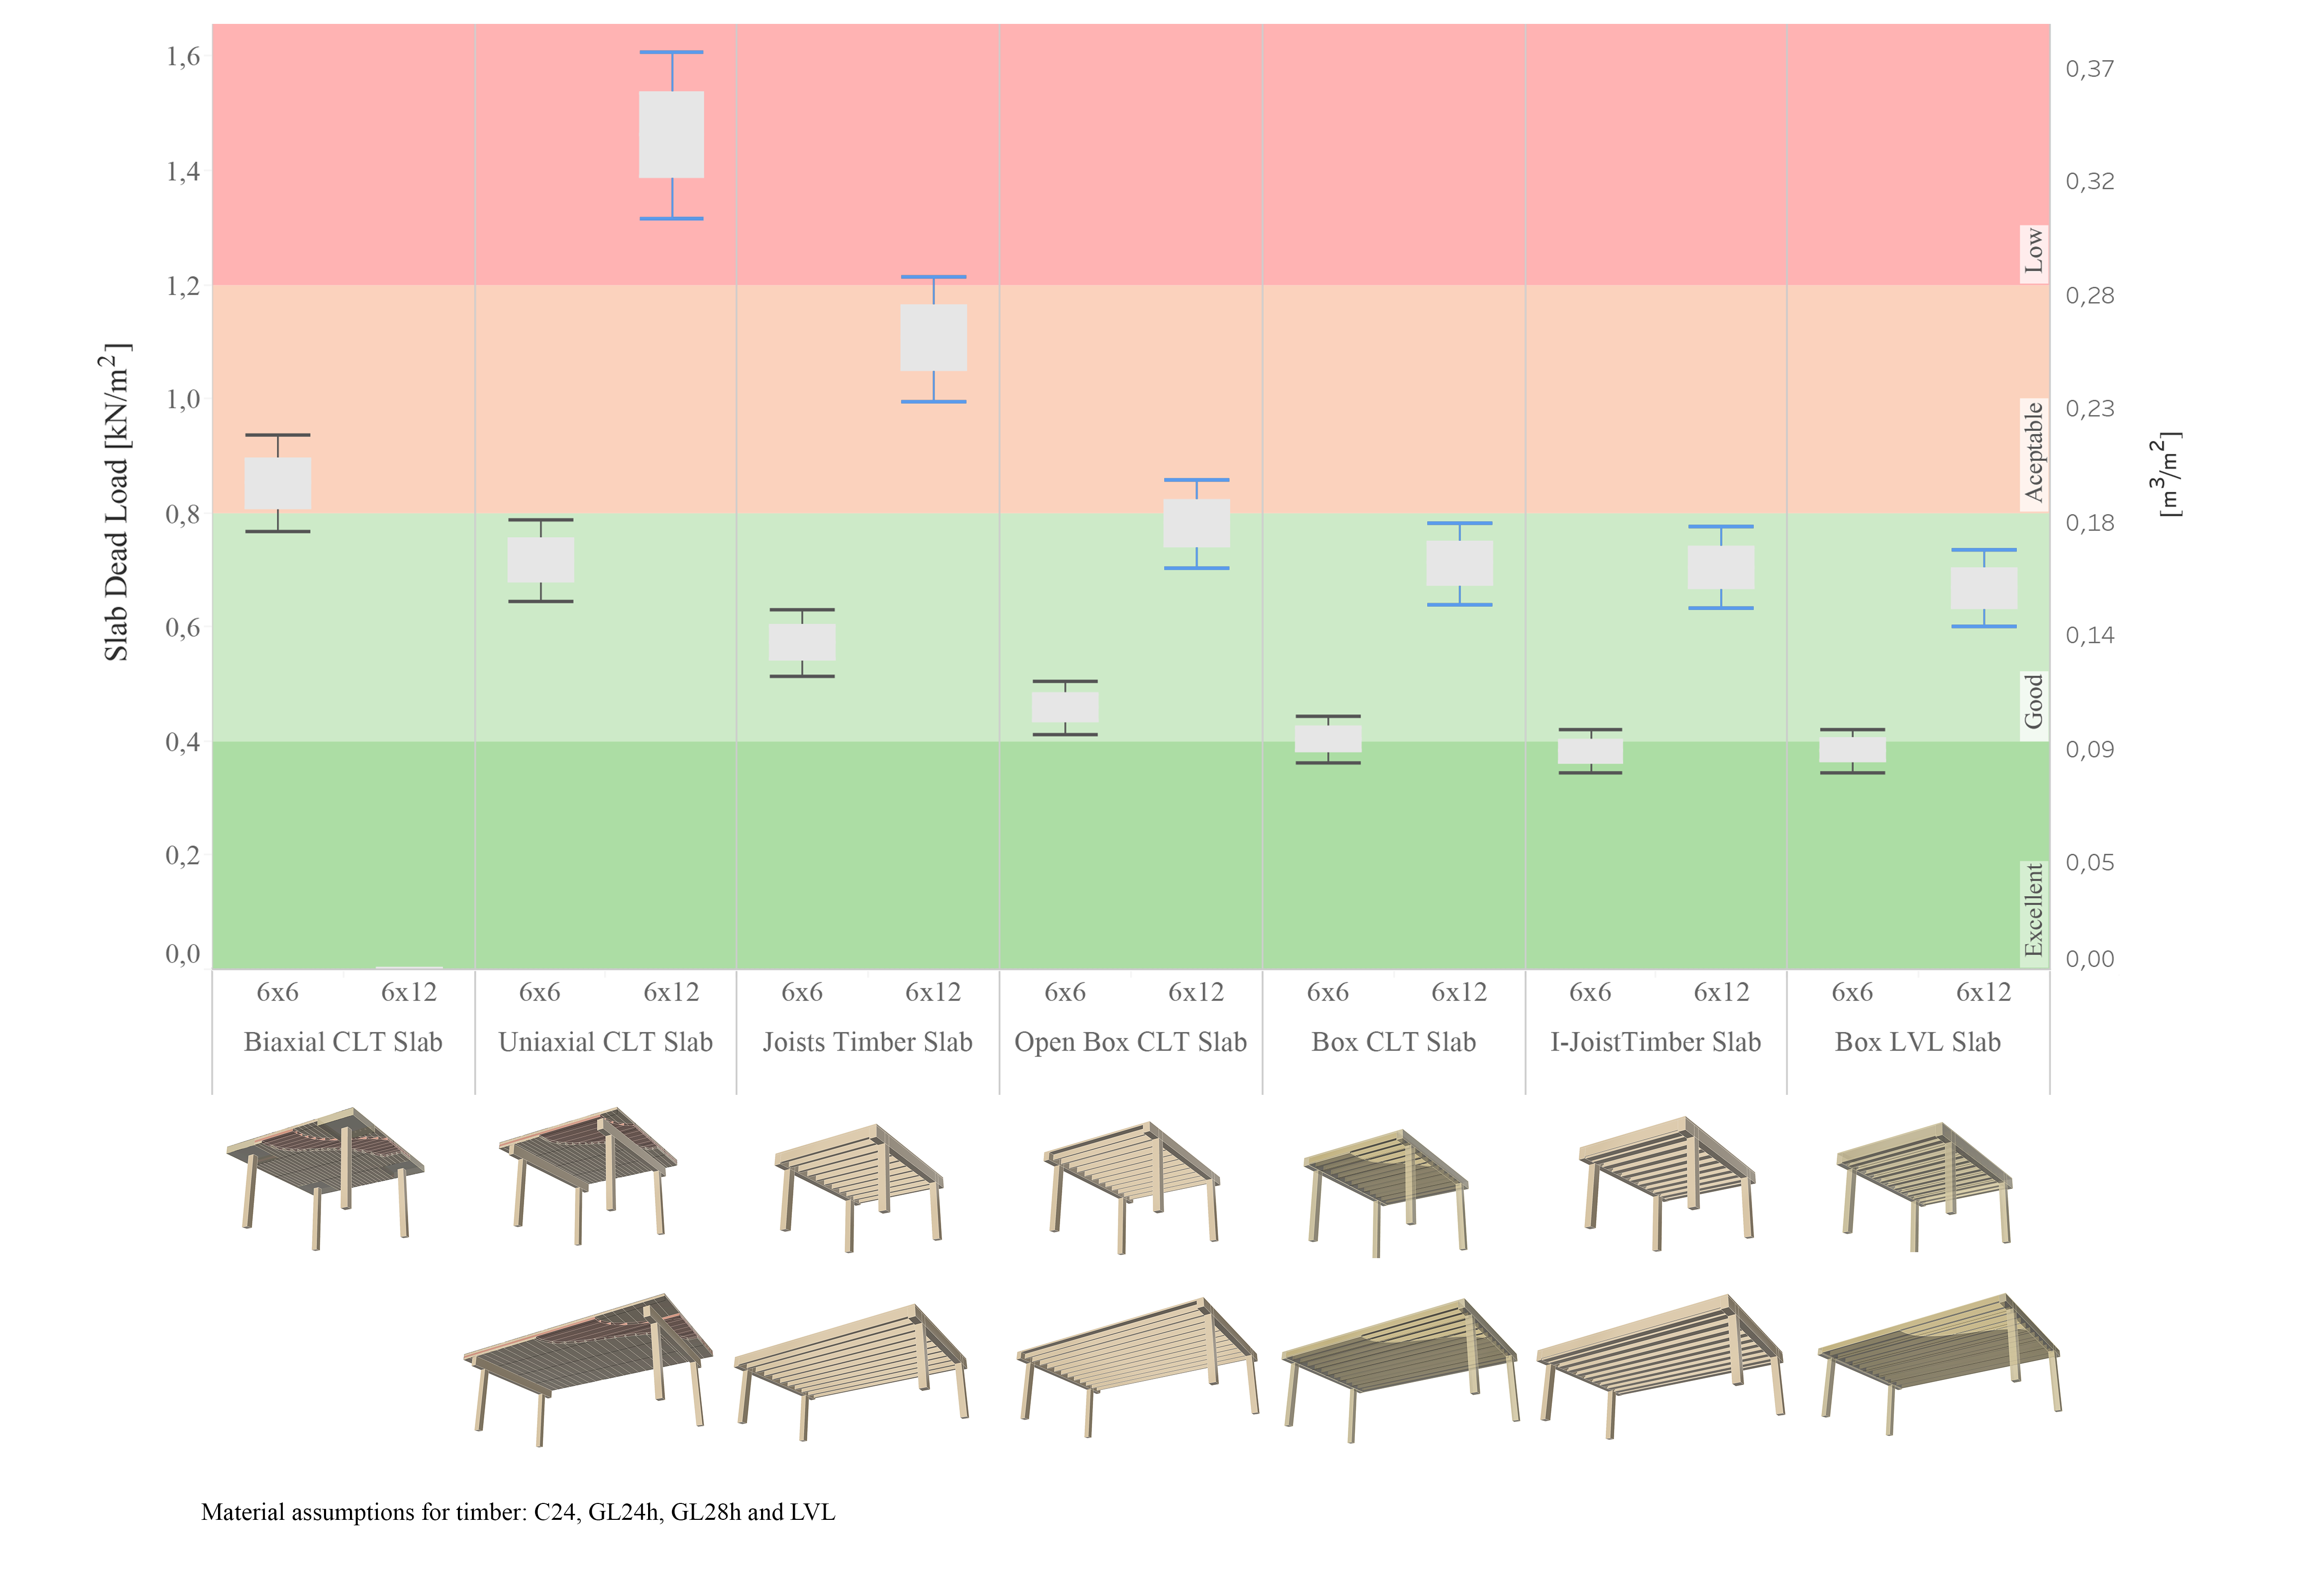
Volume / Area [m3 / m2]
Source: JRC
Figure 57. Structural resource intensity for composite slabs (concrete C25/30, C50/60; steel S235, S355; timber C24, GL24h).
Self-weight g [kN/m2]
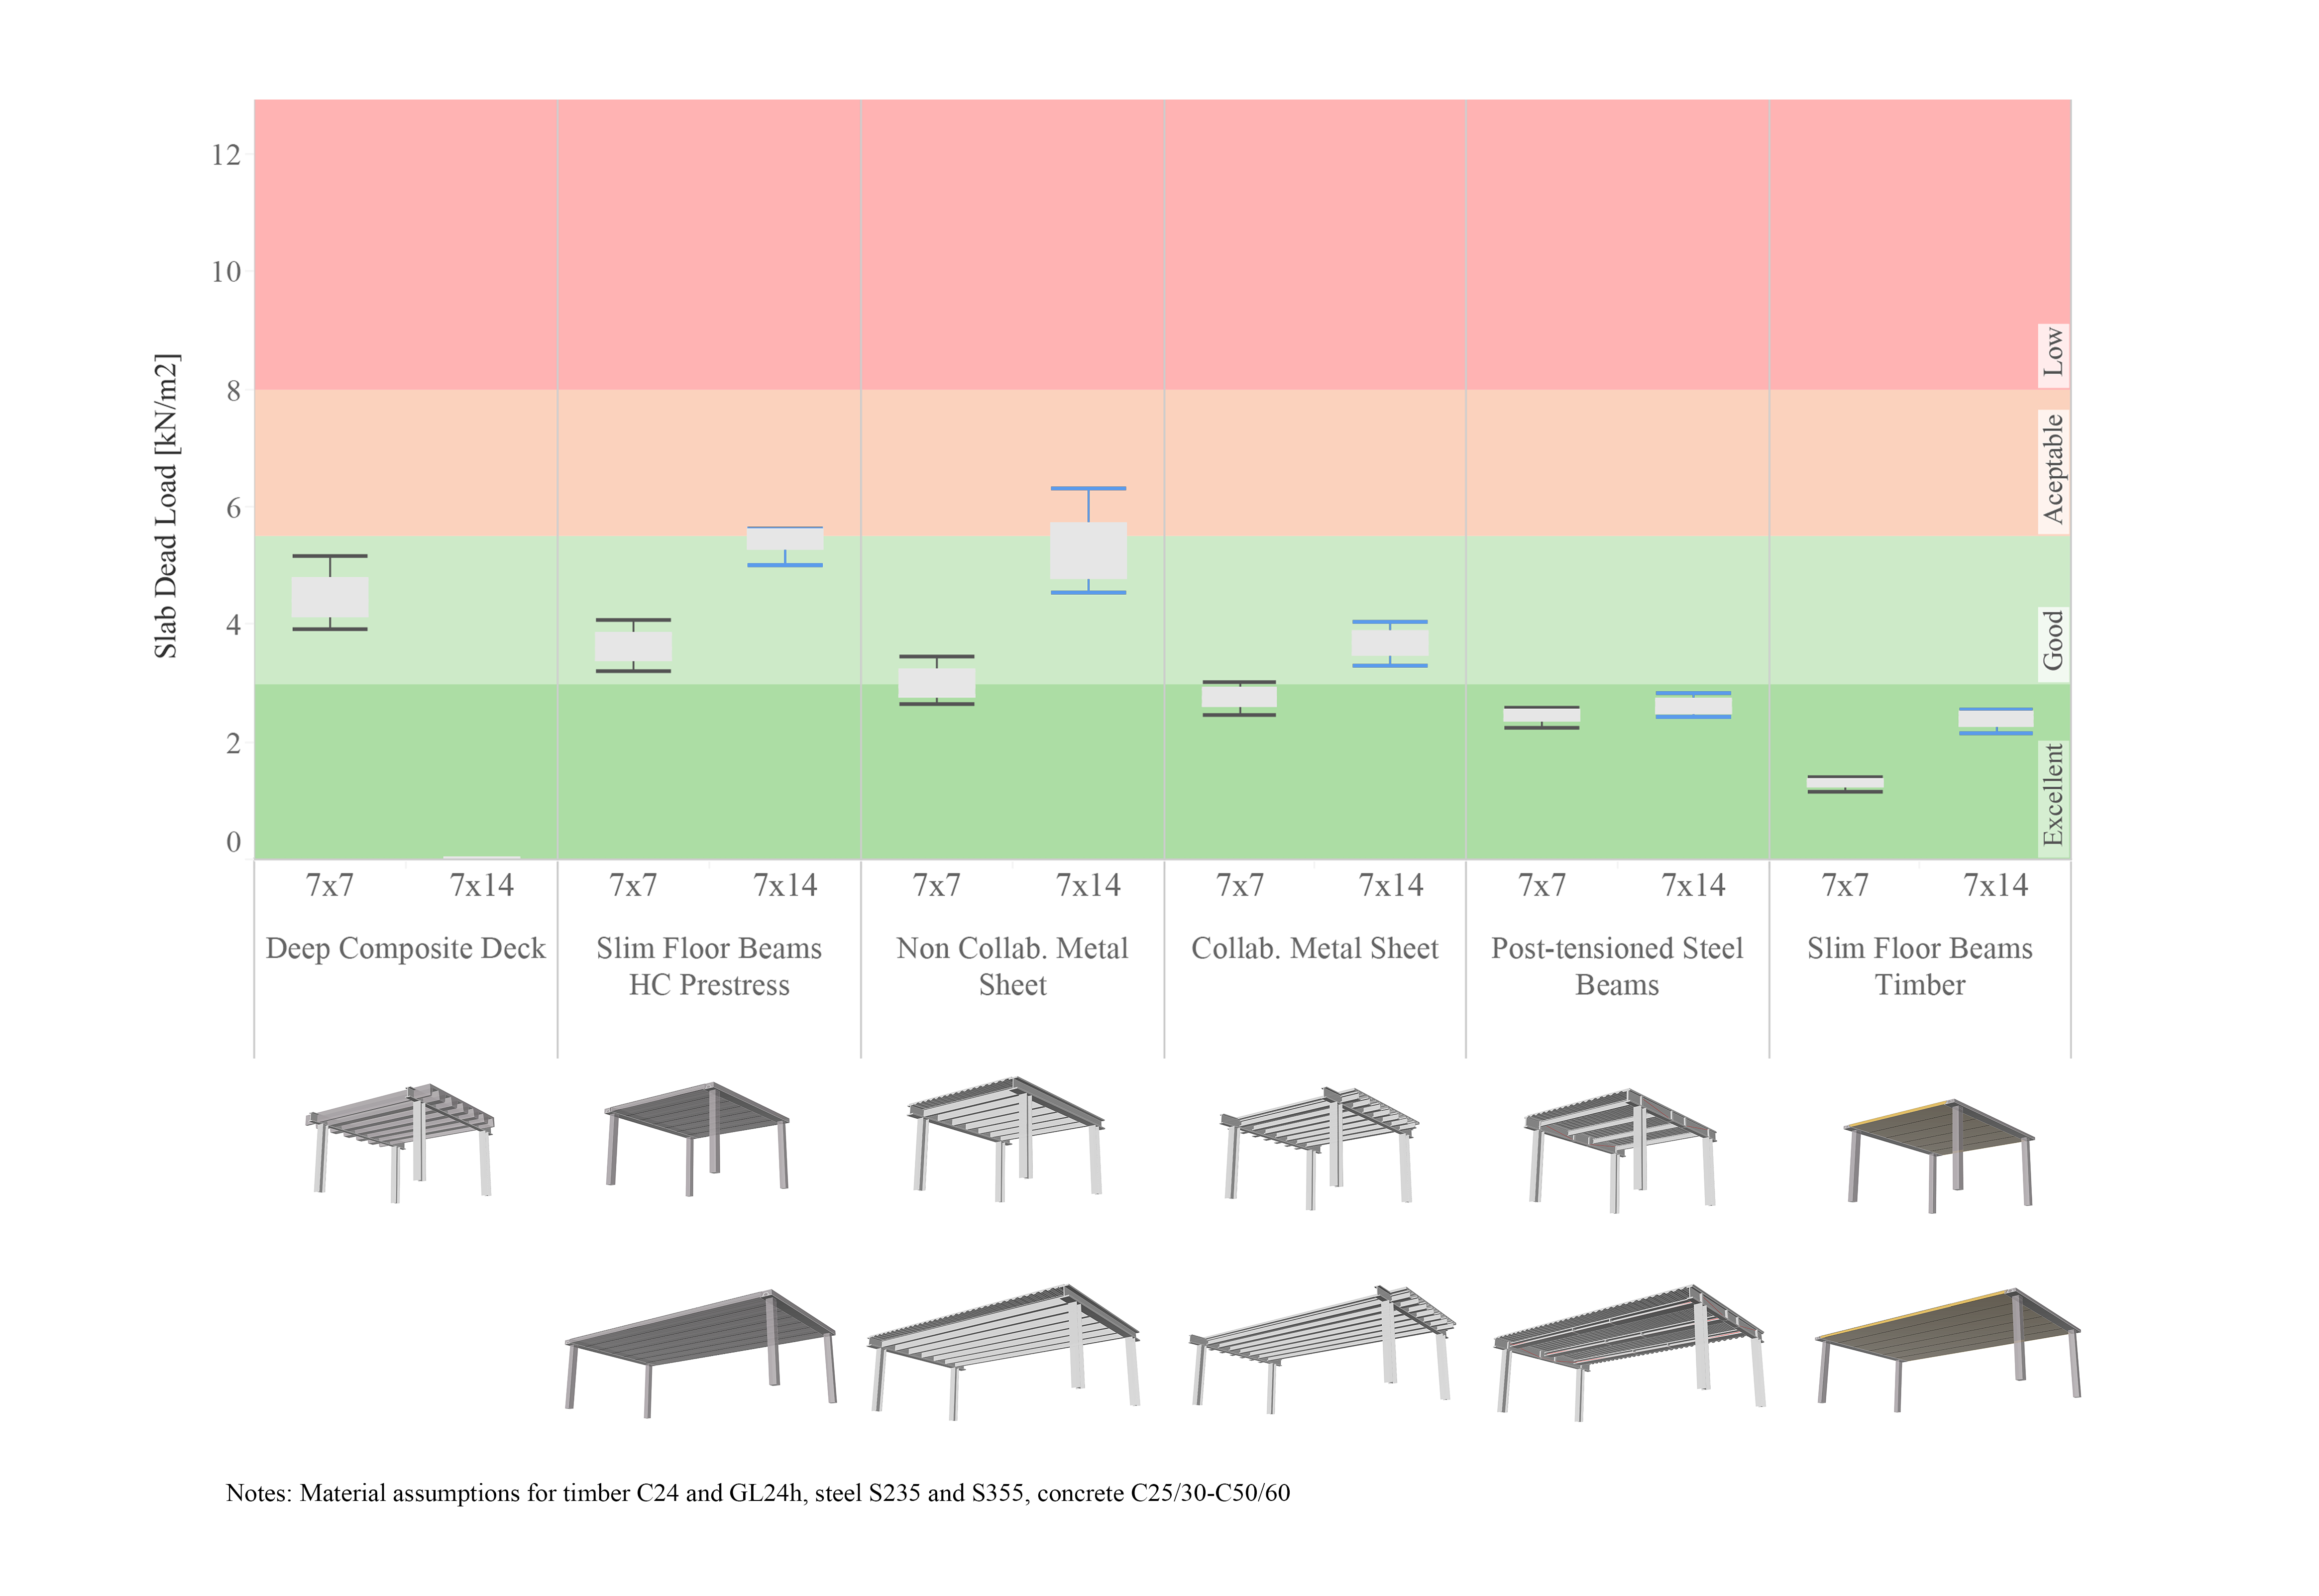
Source: JRC
For timber floor slabs, a metric of material volume per floor area (in m3/m2) is added as a secondary vertical axis, since it is commonly used in practice. However, B.2.3 score for self-assessment is based on the self-weight g. The conversion to material volume per floor area is approximate, considering a density of timber equal to 415 kg/m3 that is the average value of C24 timber (350 kg/m3) and laminated veneer lumber (LVL) (480 kg/m3).
For composite floor slabs, a homogenisation coefficient (a) was employed to convert the weight contribution of other materials to concrete-equivalent values. For a generic material, the homogenisation coefficient is given as:

(132)
where, E and ρ are the Young’s modulus and density, respectively, for a generic material (i) and concrete (c). Referring to the materials considered in this investigation, for concrete-timber composites, a takes values in the range of 1.9–2.5. The lower value was obtained using C50/60 concrete and LVL, while the upper value using C25/30 concrete and C24 timber. For concrete-steel composites, a takes values in the range of 1.8–2.2. Lower and upper bounds were obtained using C50/60 and C25/30 concrete, respectively. The steel Young’s modulus and density did not vary with the considered steel grades (i.e. S235 and S355). The concrete specific weight was set to 25 kN/m3 regardless of the class.
From the carried-out investigation, it is possible to identify lower and upper bounds of the slab self-weight g for each material, denoted as glb and gub, respectively. These correspond to the value of the performance classes Excellent and Low indicated in Table 53.
Table 53. Performance classes expressed in material weight g in kN/m2 for concrete, timber and composite floor systems.
| Low (gub) | Acceptable | Good | Excellent (glb) | |
| Concrete | g ≥ 9.5 | 9.5 > g ≥ 6.5 | 6.5 > g ≥ 3.5 | g < 3.5 |
| Timber | g ≥ 3.5 | 3.5 > g ≥ 2.2 | 2.2 > g ≥ 0.9 | g < 0.9 |
| Composite | g ≥ 5.0 | 5.0 > g≥ 3.75 | 3.75 > g ≥ 2.5 | g < 2.5 |
Source: JRC.
The score of B.2.3 is evaluated using a linear interpolation between the bounds, according to Equation (133). Lower and upper score bounds are B.2.3lb = 30 and B.2.3ub = 80, whereas the slab weight bounds are indicated in Table 53 for each considered material (glb, gub). Figure 55–Figure 57 may provide a range of g values as a function of the slab construction technology, main span and material at the early stages of design to evaluate alternative design solutions and improve the indicator score.
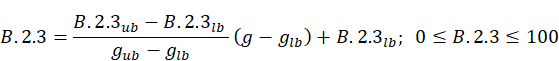
(133)
The indicator score bounds have been chosen so that the application of standard practice is expected to result in the Acceptable performance class (Figure 58). Thoughtful design choices in the support distribution and floor shapes enable efficient material use, when common and economical construction technologies are adopted. On the other hand, when programmatic and architectural choices favour large spans for functional reasons (i.e. to improve circulation, daylight penetration, etc.), high performance structural solutions become essential to minimise material consumption.
Higher performance classes can be achieved by employing more advanced design workflows that include parametric design and structural optimisation. Among innovative construction technologies that have a good potential are functionally graded concrete slabs, i.e. slabs with optimised gradient of porosity obtained by placing mineral void formers in the cross-section (Schmeer and Sobek, 2018). This can be thought of as an optimised variant of a voided biaxial slab using mineral void formers, which facilitates recycling compared to conventional solution using plastic void formers (Nigl et al., 2022). This technology has been applied to the design of the foundation and basement slabs of the new Large-scale Construction Robotics Laboratory (LCRL) at the University of Stuttgart (Haufe et al., 2024).
Vaulted floor systems (Hawkins et al., 2019) and rib-stiffened funicular floor systems (Rippmann et al., 2018) are innovative solutions that draw on experience of Gothic master builders, comprising double curved shells and post-tensioned ties between the slab corners to sustain the horizontal thrusts. These solutions are being reconsidered thanks to digital fabrication methodologies that ease construction feasibility of systems characterised by a more complex geometry than conventional flat slabs. Material savings exceeding 50% have been reported compared to conventional flat slabs (Liew et al., 2017).
An emerging approach to structural design involves the strategic integration of sensors and mechanical actuators to design structural systems that can counteract actively the effect of loads. The effect of actuation can be employed to redirect the stress from critically loaded components and reduce deformations. This approach is particularly effective for stiffness-governed design problems, e.g. tall and slender buildings, and long-span floor systems and bridges. Numerical and experimental tests have demonstrated that well-designed adaptive structures, including floor systems, can achieve material and associated emission savings exceeding 50%, compared to equivalent optimised passive solutions (Blandini et al., 2022; Reksowardojo et al., 2024; Senatore and Wang, 2024).
In the box plot map of Figure 55, emerging technologies for concrete slabs are reported on the right side of the dashed line. For vaulted floor systems, values are adapted from a structural design developed by ARUP and Laing O’Rourke on a 9 · 9 m layout (Scott, 2022). The adaptive ribbed slab is an experimental design developed at the University of Stuttgart that uses active tendons integrated in the ribs to counteract the effect of superimposed dead and live load (Reksowardojo et al., 2024). Further information about these systems is given in Table A. 1.
Figure 58 shows the indicator thresholds used to link indicator scores with performance classes for B.2.3. While these thresholds and performance classes are not directly applied in the evaluation of KPI and dimension scores and performance classes, they are included here to assist users in determining appropriate performance levels for specific project aspects and to offer clear guidance on their improvement.
Figure 58. B.2.3 indicative performance classes and thresholds.

Source: JRC.
4.5.5 Example (B.2)
In the following example a renovation project type for non-residential main use is considered, namely the structural design of a new multi-span 28.0 · 21.0 m concrete slab for an existing office building. The assessment is carried out at the building scale and no listed cultural heritage is affected by the project. A project team involved in the structural design of a multi-span 28.0 · 21.0 m concrete slab for an office building consists of the following members: (i) project manager; (ii) architect; (iii) civil engineer; (iv) main contractor.
All the parties are qualified to pursue the professional activity, as demonstrated by their enrolment in national professional or trade registers. The economic and financial standing is demonstrated through a ratio of the annual revenue of the involved parties to their annual contract value higher than one, in the last three years. Moreover, the parties are protected by professional risk indemnity insurances with an appropriate liability limit to provide coverage against claims for loss or damage in the specific current work. The technical and professional capacity of the team is demonstrated through participation in the previous five years in more than four works of the same nature and complexity and with values equal or greater than the value of the current project. Finally, the project manager has more than ten years of experience in delivering similar projects. These criteria are considered sufficient in the self-assessment to satisfy the PPD criteria (Directive, 2014) for both the design team (+25) and contractors (+25). Moreover, the project manager satisfies the comprehensive GPP criteria (+30), having experience in the design of environmentally efficient buildings, as demonstrated by works delivered in the previous five years, expertise in LCA analysis, and certification in well-established multicriteria rating schemes. Other members do not have any specific demonstrable competencies in green technologies, design or construction. Considering this consortium, B.2.1 equals 25 + 25 + 30 = 80 (corresponding to Excellent performance according to Figure 52).
Initially, the team designs a uniaxial slab (Design alternative 1, in Table 54). The slab is supported on beams and has spans of 7.0 and 14.0 m having a layout of column support as shown in Figure 54a. The design is carried out considering a permanent additional load of g2 = 2.0 kN/m2 and an imposed live load of q = 3.0 kN/m2. The design results in 300 m3 of concrete, expected to be cast in place.
60% of concrete (in terms of volume), including recycled materials, is purchased from organisations with a certificated environmental management system. Accordingly, B.2.2 score is equal to 60 (corresponding to a Good performance class according to Figure 53). The design solution is estimated to require a concrete usage per unit area of g = 12.7 kN/m2. Using Equation (133), B.2.3 score is given by:
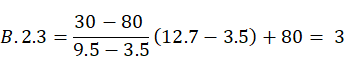 |
(134)
(achieving Low performance, according to Figure 58). From Equation (130), B.2 score is given by:
(135)
which corresponds to a Low performance class (Figure 51) and a performance class score PCSB2 = 0 (Figure ).
Then, the project team designs a second configuration (shown in Figure 54b), characterised by a point-supported flat slab with a 7.0 · 7.0 m column grid. For this configuration, the expected volume of concrete reduces to 150 m3. Considering the same percentages of responsibly sourced materials, B.2.2 is kept as 60, whereas the concrete usage per unit area reduces to g = 6.3 kN/m2, corresponding to a B.2.3 score of 57 (thus, a Good performance class). Combining the three indicator values, B.2 scores is equal to 65, corresponding to an Acceptable performance class and a performance class score PCSB2 = 40.
The flat slab solution with reduced column spacing performs well, however, the developer perceives a potential value decrease due to a lower space flexibility. The project team designs a third alternative solution with a bidirectional voided slab on 7.0 · 14.0 m bays (configuration shown in Figure 54a). Compared to the first solution, the expected volume of concrete reduces to 188 m3 (-37%), with a material usage of g = 8 kN/m2, corresponding to a B.2.3 score of 43. Keeping the same sourcing requirements for indicator B.2.2, B.2 score is found equal to 59, which corresponds to an Acceptable performance class and a performance class score PCSB.2 = 40.
Table 54. Example of B.2 evaluation.
| Item | Score | Performance class |
| Case study 1 | ||
| B.2.1 | 80 | (Excellent)1 |
| B.2.2 | 60 | (Good) 1 |
| B.2.3 | 3 | (Low) 1 |
| B.2 | 43 | Low |
| PCSB.2 | 0 | — |
| Case study 2 | ||
| B.2.1 | 80 | (Excellent) 1 |
| B.2.2 | 60 | (Good) 1 |
| B.2.3 | 57 | (Good) 1 |
| B.2 | 65 | Acceptable |
| PCSB.2 | 40 | — |
| Case study 3 | ||
| B.2.1 | 80 | (Excellent) 1 |
| B.2.2 | 60 | (Good) 1 |
| B.2.3 | 43 | (Acceptable) 1 |
| B.2 | 59 | Acceptable |
| PCSB.2 | 40 | — |
1 Transformation of the indicator score to an indicator performance class is indicative and not required by the self-assessment method to estimate KPI and dimension scores and performance classes.
Source: JRC.